
Grafana vs. Kibana: The Key Differences to Know

#Note: Elastic recently announced it would implement closed-source licensing for new versions of Elasticsearch and Kibana beyond Version 7.9. For more details, read our CEO Tomer Levy’s comments on Truly Doubling Down on Open Source.
We live in a world of big data, where even small-sized IT environments are generating vast amounts of data. Once an organization has figured out how to tap into the various data sources generating the data, and the method for collecting, processing and storing it, the next step is analysis.
Analysis methods vary depending on use case, the tools used and of course the data itself, but the step of visualizing the data, whether logs, metrics or traces, is now considered a standard best practice. Visualizing data helps teams monitor their environment, detect patterns and take action when identifying anomalous behavior. In case of diagnostics and after-the-fact root cause analysis, visualizing data provides visibility required for understanding what transpired at a given point in time.
Grafana and Kibana are two popular open source tools that help users visualize and understand trends within vast amounts of log data, and in this post, I will give you a short introduction to each of the tools and highlight the key differences between them.
Kibana
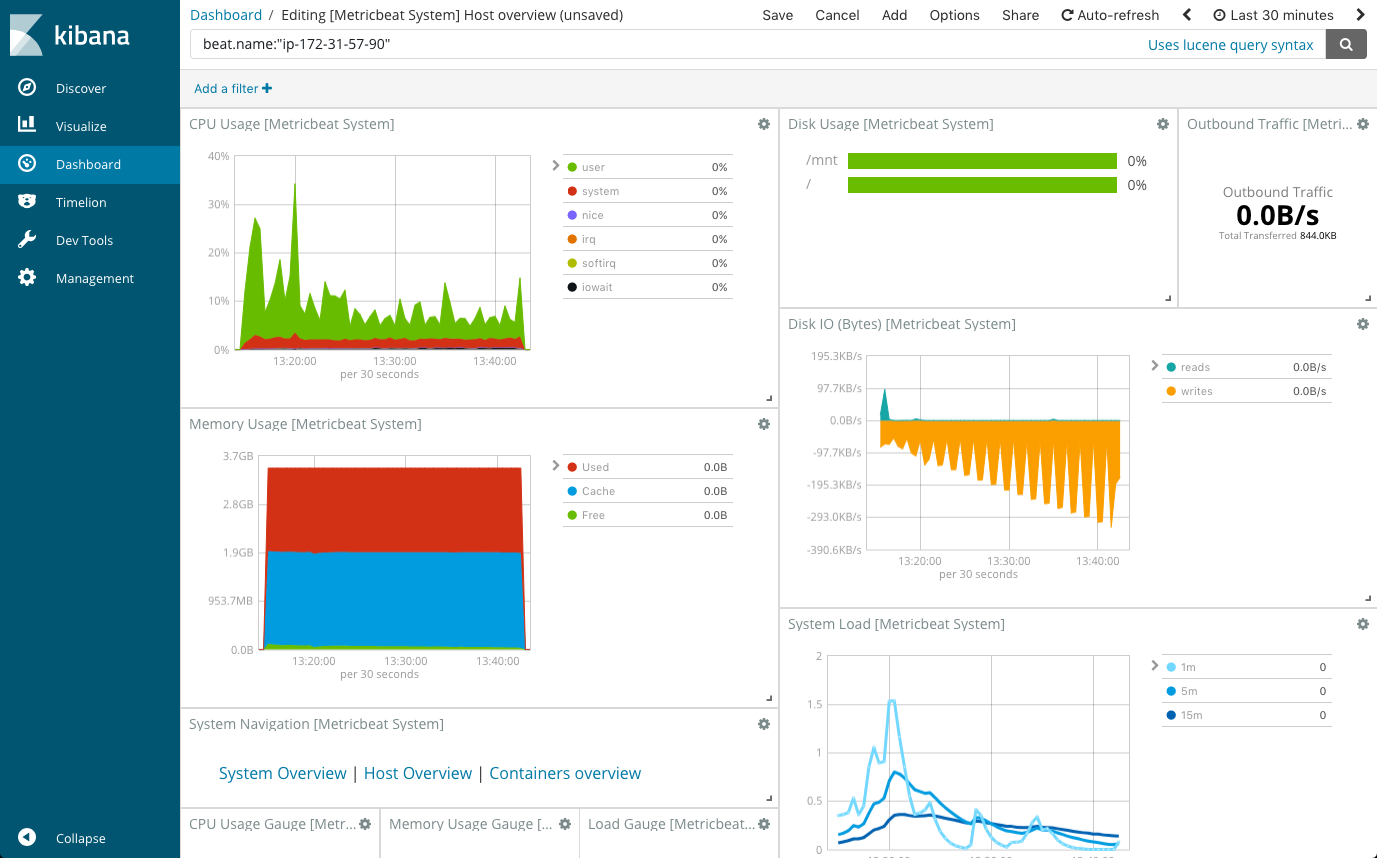
Kibana is the ‘K’ in the ELK Stack, the world’s most popular open source log analysis platform, and provides users with a tool for exploring, visualizing, and building dashboards on top of the log data stored in Elasticsearch clusters.
Kibana’s core feature is data querying and analysis. Using various methods, users can search the data indexed in Elasticsearch for specific events or strings within their data for root cause analysis and diagnostics. Based on these queries, users can use Kibana’s visualization features which allow users to visualize data in a variety of different ways, using charts, tables, geographical maps and other types of visualizations.
Grafana
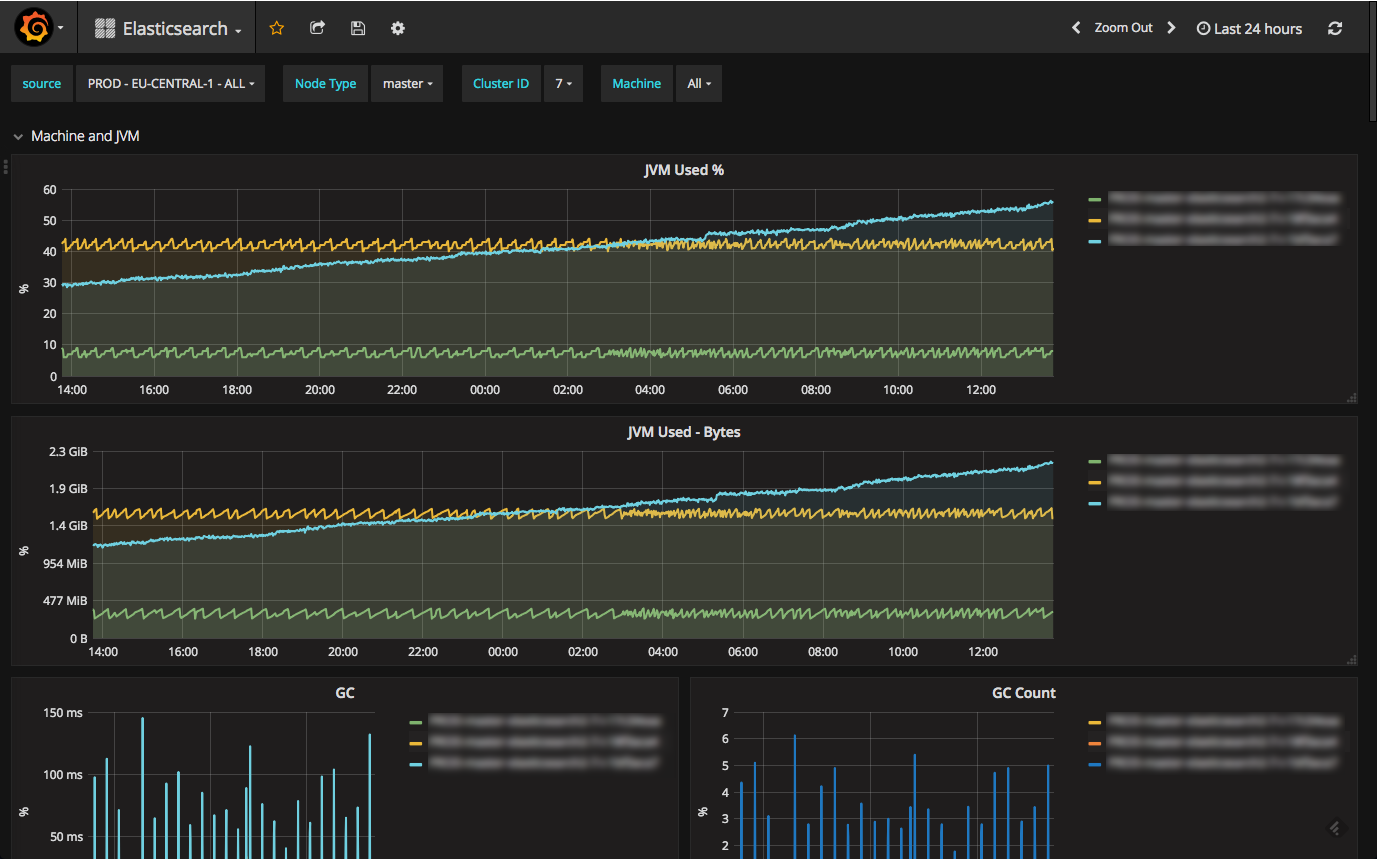
Grafana is a free and open source (FOSS/OSS) visualization tool that can be used on top of a variety of different data stores but is most commonly used together with Graphite, InfluxDB, Prometheus, and Elasticsearch. As it so happens, Grafana began as a fork of Kibana, trying to supply support for metrics (a.k.a. monitoring) that Kibana (at the time) did not provide much if any such support for.
Essentially, Grafana is a feature-rich replacement for Graphite-web, which helps users to easily create and edit dashboards. It contains a unique Graphite target parser that enables easy metric and function editing. Users can create comprehensive charts with smart axis formats (such as lines and points) as a result of Grafana’s fast, client-side rendering — even over long ranges of time — that uses Flot as a default option.
1. Logs vs. Metrics (Logging vs. Monitoring)
The key difference between the two visualization tools stems from their purpose. Grafana’s design for caters to analyzing and visualizing metrics such as system CPU, memory, disk and I/O utilization. The platform does not allow full-text data querying. Kibana, on the other hand, runs on top of Elasticsearch and is used primarily for analyzing log messages.
If you are building a monitoring system, both can do the job pretty well, though there are still some differences that will be outlined below. If it’s logs you’re after, for any of the use cases that logs support — troubleshooting, forensics, development, security, Kibana is your only option.
Future
Both tools’ backers are trying to expand their scope. It is certainly possible to ship metrics data to Kibana and logging data to Grafana, but neither is perfectly suited for either task just yet.
Grafana Labs — which maintains Grafana — has released Loki, a solution meant to complement the main tool in order to better parse, visualize and analyze logging. One of the drawbacks is Loki doesn’t index the content of the logs. Instead, it categorizes them according to labels associated with given log streams. This might make it suitable for scenarios where labels can be recognized quickly, like with Kubernetes pod logs. Otherwise, the ELK Stack still has Grafana beat.
2. Setup, installation and configuration
Both Kibana and Grafana are pretty easy to install and configure. Both support installation on Linux, Mac, Windows, Docker or building from source. Kibana supports a wider array of installation options per operating system, but all in all — there is no big difference here. Since Kibana is used on top of Elasticsearch, a connection with your Elasticsearch instance is required.
Grafana is configured using an .ini file which is relatively easier to handle compared to Kibana’s syntax-sensitive YAML configuration files. Grafana also allows you to override configuration options using environment variables.
Here is an Grafana installation tutorial and a Kibana installation tutorial.
3. Data sources and integrations
Grafana was designed to work as a UI for analyzing metrics. As such, it can work with multiple time-series data stores, including built-in integrations with Graphite, Prometheus, InfluxDB, MySQL, PostgreSQL, and Elasticsearch, and additional data sources using plugins. For each data source, Grafana has a specific query editor that is customized for the features and capabilities that are included in that data source. Kibana on the other hand, is designed to work only with Elasticsearch and thus does not support any other type of data source.
Kibana on the other hand, is designed to work only with Elasticsearch and thus does not support any other type of data source. In order to extrapolate data from other sources, it needs to be shipped into the ELK Stack (via Filebeat or Metricbeat, then Logstash, then Elasticsearch) in order to apply Kibana to it.
This following tutorial shows how to migrate MongoDB data to Kibana via Logstash, then eventually to our managed ELK Stack solution. The principle is similar to non-managed open source scenarios. For info on adding Filebeat to the mix, look at this Filebeat tutorial; for monitoring with Metricbeat, check this Metricbeat tutorial.
4. Access control and authentication
By default, and unless you are using either the X-Pack (a commercial bundle of ELK add-ons, including for access control and authentication) or open source solutions such as SearchGuard, your Kibana dashboards are open and accessible to the public. In comparison, Grafana ships with built-in user control and authentication mechanisms that allow you to restrict and control access to your dashboards, including using an external SQL or LDAP server. In addition, Grafana’s API can be used for tasks such as saving a specific dashboard, creating users, and updating data sources. You can also create specific API keys and assign them to specific roles.
5. Querying
Querying and searching logs is one of Kibana’s more powerful features. Using either Lucene syntax, the Elasticsearch Query DSL or the experimental Kuery, the data stored in Elasticsearch indices can be searched with results displayed in the main log display area in chronological order. Lucene is quite a powerful querying language but is not intuitive and involves a certain learning curve.
Grafana, users use what is called a Query Editor for querying. Each data source has a different Query Editor tailored for the specific data source, meaning that the syntax used varies according to the data source. Graphite querying will be different than Prometheus querying, for example.
6. Dashboards and visualizations
Both Kibana and Grafana boast powerful visualization capabilities. Kibana offers a rich variety of visualization types, allowing you to create pie charts, line charts, data tables, single metric visualizations, geo maps, time series and markdown visualizations, and combine all these into dashboards. Dashboards in Kibana are extremely dynamic and versatile — data can be filtered on the fly, and dashboards can easily be edited and opened in full-page format. Kibana ships with default dashboards for various data sets for easier setup time.
Grafana dashboards are what made Grafana such a popular visualization tool. They are infamous for being completely versatile. Visualizations in the software are called panels, and users can create a dashboard containing panels for different data sources. Grafana supports graph, singlestat, table, heatmap and freetext panel types. The software’s users can make use of a large ecosystem of ready-made dashboards for different data types and sources.
Functionality wise — both Grafana and Kibana offer many customization options that allow users to slice and dice data in any way they want. Users can play around with panel colors, labels, X and Y axis, the size of panels, and plenty more. All in all though, Grafana has a wider array of customization options and also makes changing the different setting easier with panel editors and collapsible rows.
7. Alerts
A key difference between Kibana and Grafana is alerts. Since version 4.x, Grafana has shipped with a built-in alerting engine that allows users to attach conditional rules to dashboard panels that result in triggered alerts to a notification endpoint of your choice (e.g. email, Slack, PagerDuty, custom webhooks). Kibana does not come with an out-of-the-box alerting capability. To add alerting to Kibana users can either opt for a hosted ELK Stack such as Logz.io, implement ElastAlert or use X-Pack.
8. Community
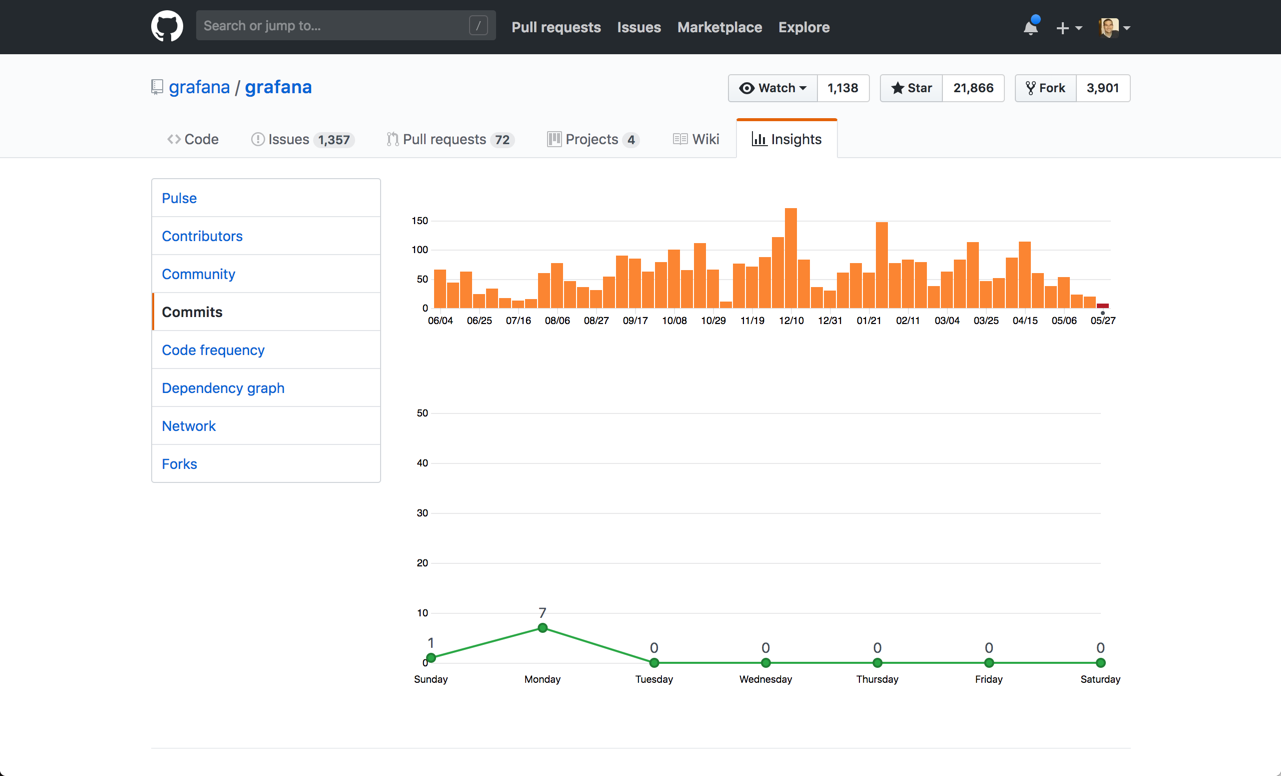
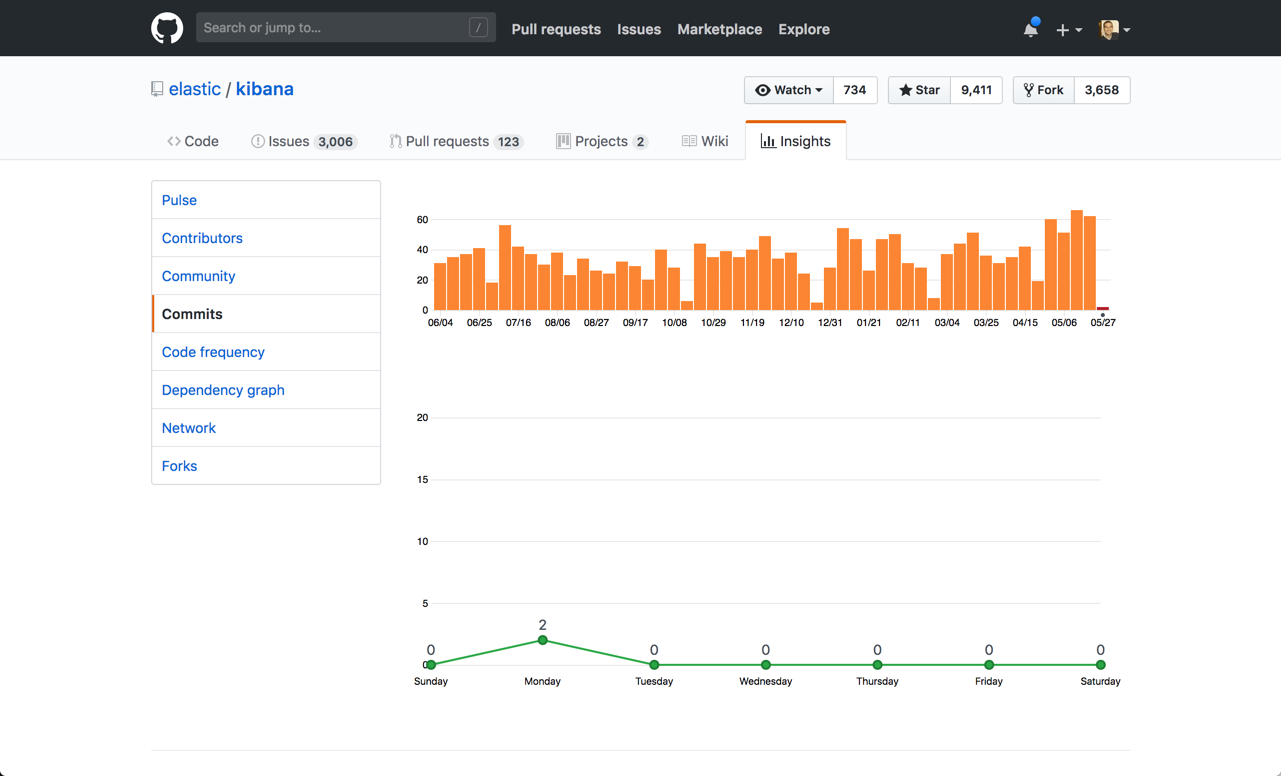
Both open source tools have a powerful community of users and active contributors. But when looking at the two projects on GitHub, Kibana seems to have the edge. Grafana has about 14,000 code commits while Kibana has more than 17,000. Both projects are highly active, but taking a closer look at the frequency of commits reflects a certain edge to Kibana.
Grafana commits over time:
Kibana commits over time:
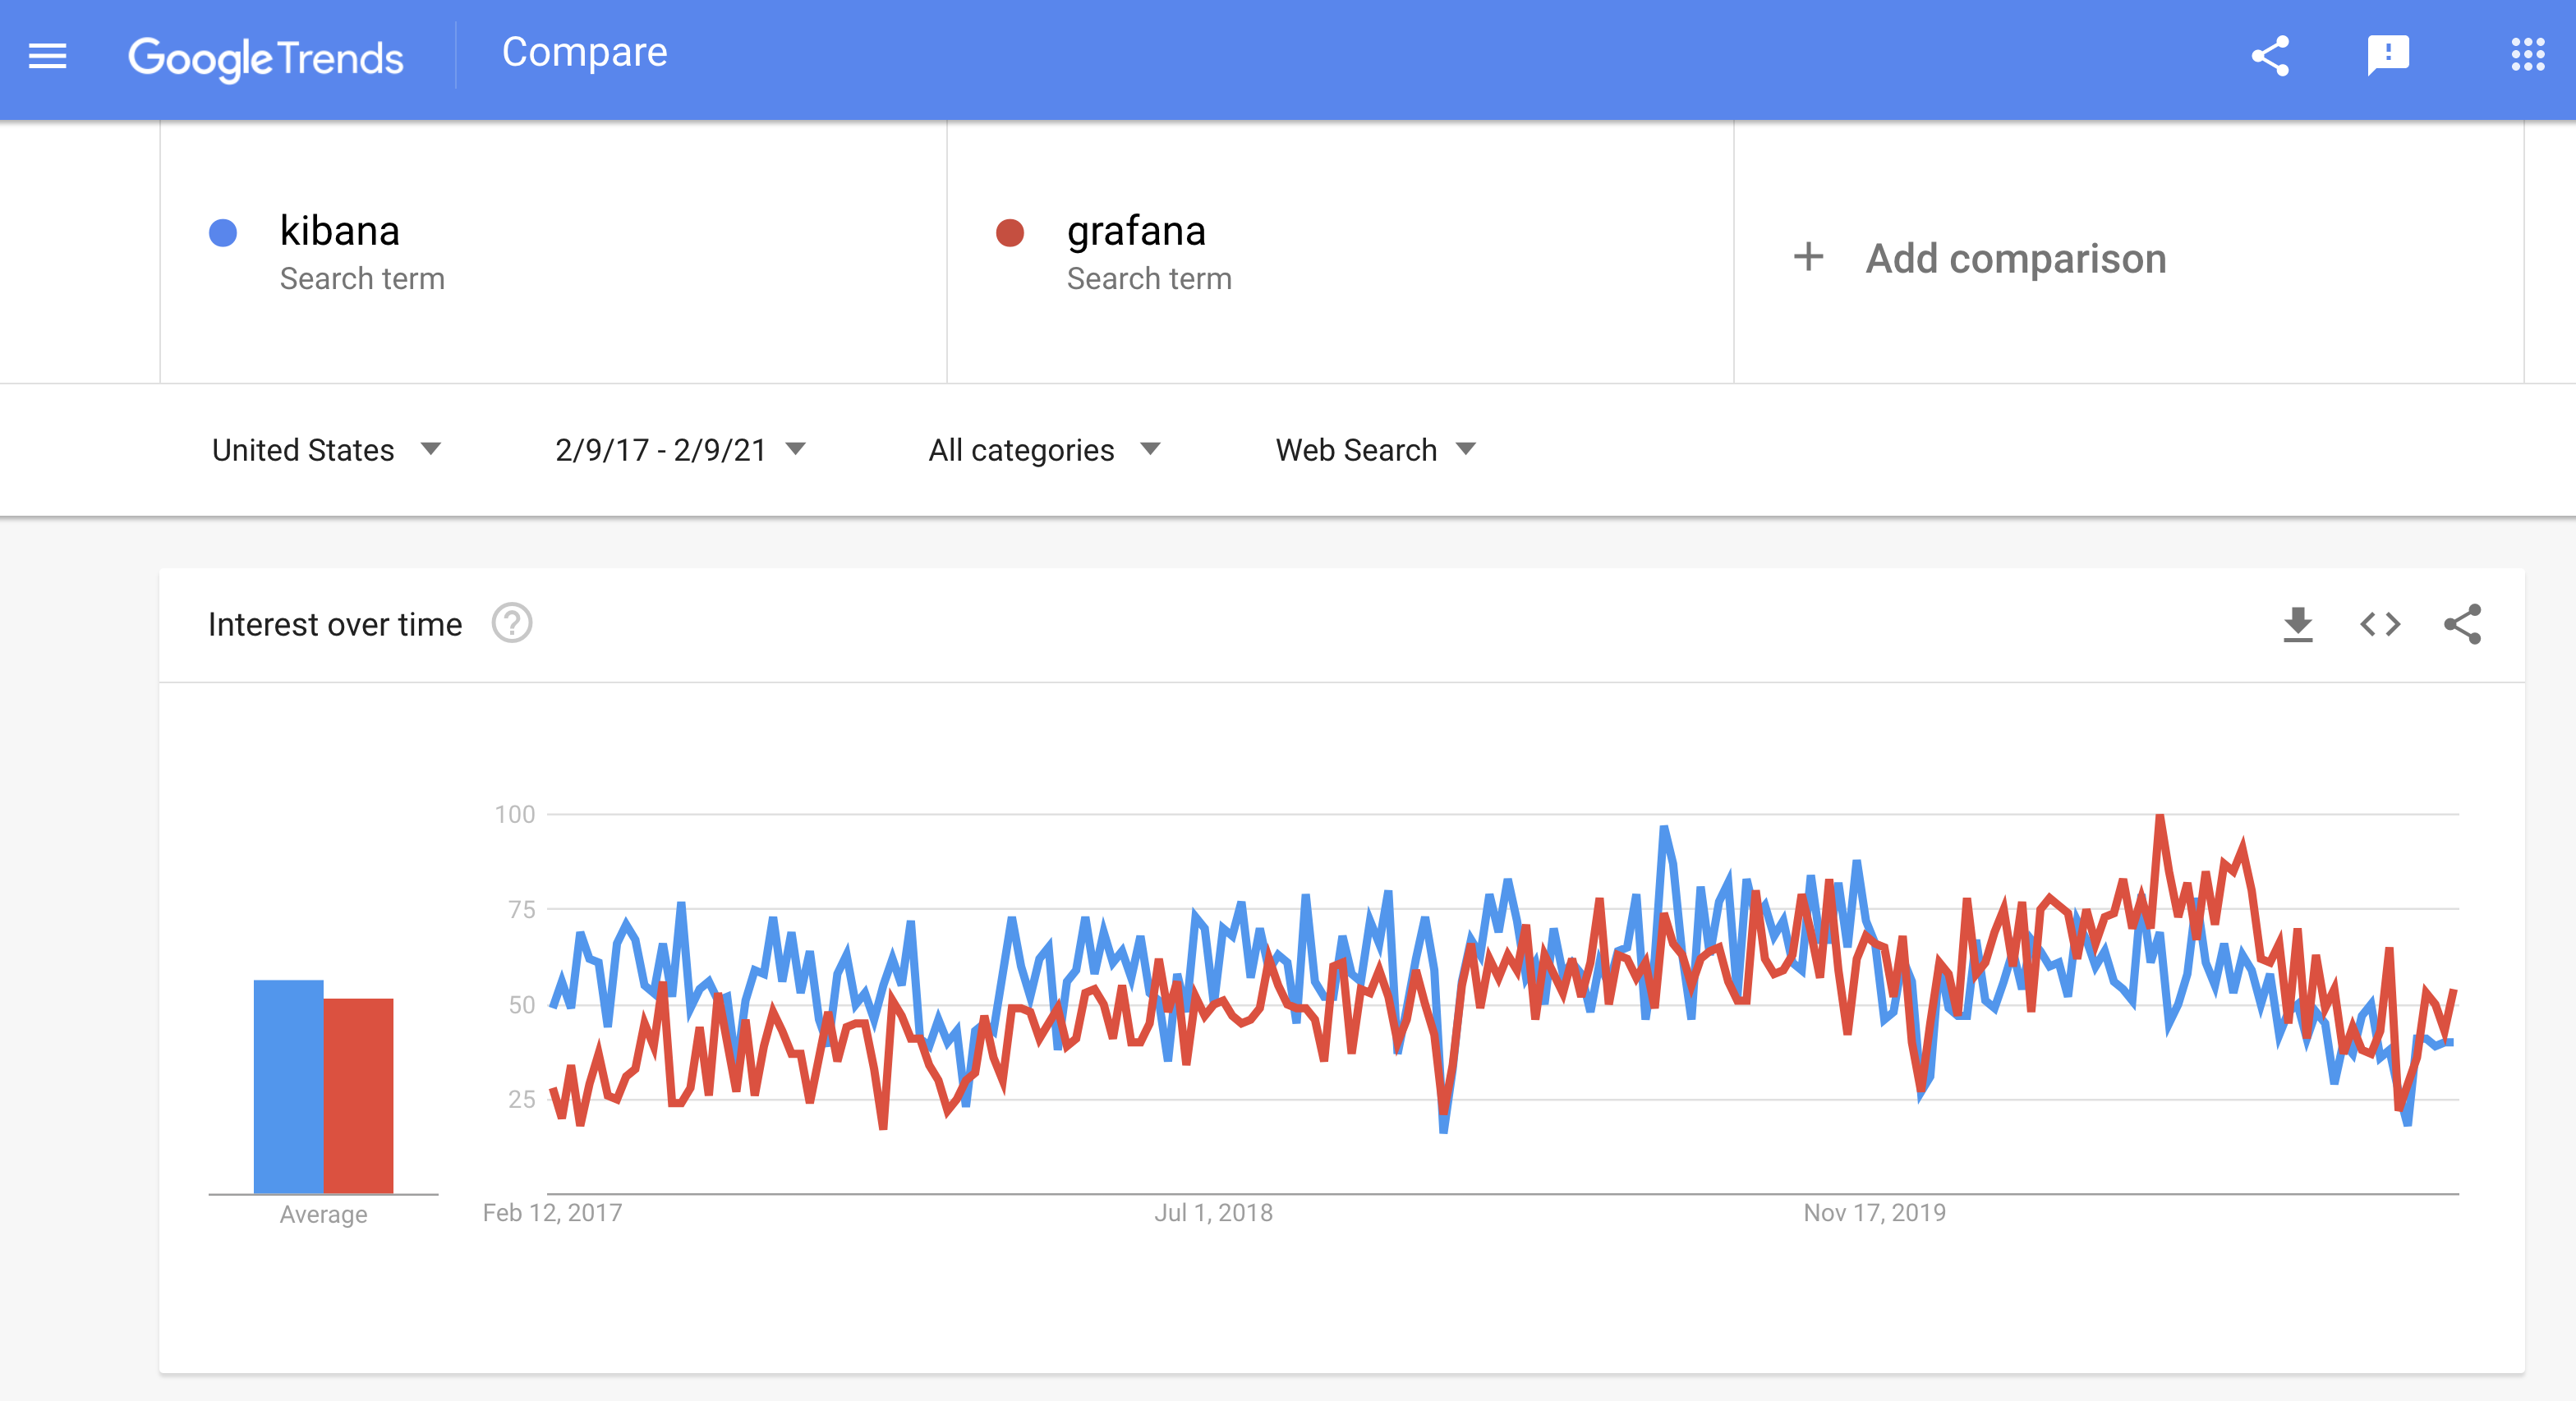
In terms of popularity, we can take a look at Google trends to get an indication. Again, Kibana seemed to have the advantage until 2020. But for a number of reasons, Grafana has eclipsed Kibana in popularity. As changes to Kibana’s license result in policy changes from different companies and projects, that gap might widen.
Grafana & Kibana in Tandem
Both Kibana and Grafana are powerful visualization tools. However, at their core, they are both used for different data types and use cases. Grafana, together with a time-series database such as Graphite or InfluxDB is a combination used for metrics analysis; on the other hand. Kibana is part of the popular ELK Stack, used for exploring log data.
Both platforms are good options and can even sometimes complement each other. As mentioned above, a significant amount of organizations will use both tools as part of their overall monitoring stack. At Logz.io we use both tools to monitor our production environment, with Grafana hooked up to Graphite, Prometheus and Elasticsearch.

You Might Also Like

AI Log Analysis – Shaping the Future of Observability

Fast-Track Kubernetes Observability with Logz.io and OpenTelemetry: A quick getting started guide
Get started for free
Completely free for 14 days, no strings attached.
