
How to Install the ELK Stack on Google Cloud Platform
April 3, 2017
In this guide, we’ll go through some of the steps needed to install the ELK Stack on Google Cloud Platform (GCP) so you can begin logging your cloud infrastructure.
Before we get started, it’s important to note two things. First, while the ELK Stack leveraged the open source community to grow into the most popular centralized logging platform in the world, Elastic decided to close source Elasticsearch and Kibana in early 2021. To replace the ELK Stack as a de facto open source logging tool, AWS launched OpenSearch and OpenSearch Dashboards as a replacement.
Second, while getting started with ELK is relatively easy, it can be difficult to manage at scale as your cloud workloads and log data volumes grow. To get around this, Logz.io manages and enhances OpenSearch and OpenSearch Dashboards at any scale – providing a zero-maintenance logging experience with added features like alerting, anomaly detection, and RBAC.
If you don’t want to manage ELK on your own, check out Logz.io Log Management.
Alas, this article is about setting up ELK, so let’s get started.
Logistical Setup
First, you’ll need to set up a Google Cloud Platform account. This is relatively straightforward. Fill out the forms, and you will have your $300/360 Free Trial setup. Setting up your application is easy, it just requires getting the Gcloud SDK setup for CLI deployment.
More on the subject:
For this example, we will use a simple ToDo application — the code can be found here. Since the application isn’t the focus here, we can deploy it and hit it a couple of times to ensure that there are some logs to export once we reach this step. The assumption here is that your application will be much more robust and in need of log management.
Getting Started with ELK Setup
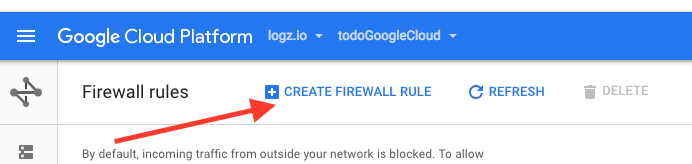
Once your application is deployed, logs should start flowing. This means it’s time for the real set up to begin. You begin by setting up Elasticsearch and Kibana on our Google Cloud installation. This is done via the Networking Console in the web interface. To get these pieces in place, you will need to set up firewall rules:
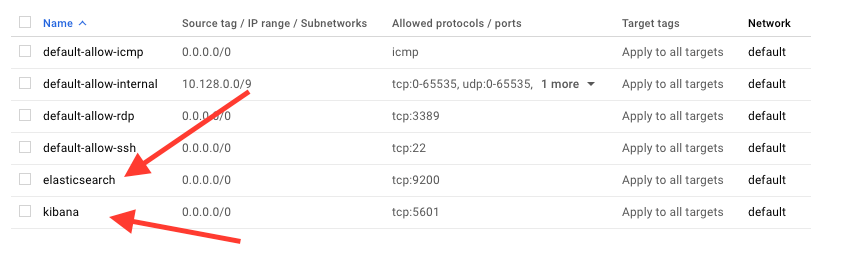
We’ll add Elasticsearch and Kibana with the IP range set to 0.0.0.0/0 and TCP protocols set to 9200 for Elasticsearch and 5601 for Kibana. (Note: Both are all lowercase as the method prescribed by the Google Cloud Firewall Rules interface.) They should appear in the firewall list as follows:
Now, you can begin to set up the actual ELK Stack. The first step is to set up an instance in Google Cloud Platform. Once the instance is set up, you can SSH into it using the following command:
$ gcloud compute ssh #{instancename}
(This assumes that you have gone through the steps with the CLI to establish a connection.)
Here you will begin the installation of Java, Elasticsearch, Logstash, and Kibana. Using the following command sets, each will be installed on your instance.
Install Java
Java installation is simple and straightforward. If you have experience with the programming language, you know to use the following command to make sure that you have the latest, stable version of Java on the instance:
$ sudo apt-get install default-jre

# Installs java and ensures we are using an up to date version. ELK stack requires version 1.8+
Install Elasticsearch
$ wget -qO - https://packages.elastic.co/GPG-KEY-elasticsearch | sudo apt-key add -
# This will fetch the latest ElasticSearch Version for us

$ sudo apt-get install elasticsearch
# This will complete the installation
You will need to adjust the configuration of Elasticsearch so that you can ensure that the network host is correct. To do so, edit the elasticsearch.yml file:
$ sudo vi /etc/elasticsearch/elasticsearch.yml
Find the line referring to the network.host portion. It will be commented out. Uncomment the file and make it read network.host “0.0.0.0” — be sure to save the file before exiting.
Back in the console, restart Elasticsearch:
$ sudo service elasticsearch restart
Install Logstash
Your next step is to install Logstash. To do so, use the following commands:
$ sudo apt-get install apt-transport-https
# This setups installs for logstash in your system

$ echo "deb https://artifacts.elastic.co/packages/5.x/apt stable main" | sudo tee -a /etc/apt/sources.list.d/elastic-5.x.list
# This will establish the source for Logstash

$ sudo apt-get update
$ sudo apt-get install logstash
# Setting up for Logstash installation

$ sudo service logstash start
# Start the logstash service so we can start shipping logs
Install Kibana
Finally, do the same for the Kibana service so that you will get nice visualizations on your logs:
$ echo "deb http://packages.elastic.co/kibana/5.3/debian stable main" | sudo tee -a /etc/apt/sources.list.d/kibana-5.3.x.list
# This will establish the source for Kibana

$ sudo apt-get update
$ sudo apt-get install kibana
# Setting up for Kibana installation
Similar to Elasticsearch, Kibana will need some configuration adjustments to work. Take a look at kibana.yml to make these changes:
$ sudo vi /etc/kibana/kibana.yml
Find the lines referring to server.port and ensure they say server.port: 5601 and server.host: “0.0.0.0”. It should only be necessary to uncomment these lines. It may also be necessary to adjust the SSL verify line elasticsearch.ssl.verificationMode: none if you are seeing problems once everything is up and running.
Once this is done, you can start the Kibana service:
$ sudo service kibana start
Success! Well… Mostly
If everything works as planned, you should be able to use the server’s IP with port 5601 specified to see if your setup was successful:

You’ve come a long way and things are looking up, but you still need to pipe in some logs. For this example, we are going to install MetricBeat to snag system metrics. The installation steps are as follows:
$ sudo apt-get install metricbeat
# Similar installation to the other features of the ELK stack

$ sudo service metricbeat start
Once MetricBeat is up and running, set it as an index pattern in the Kibana management screen as metricbeat-*. This will begin the shipping of logs, and you will have your ELK Stack set up:

There are other beats that can deliver other logs, and you can stack various beats. But just for our purposes here, we have shown you how to successfully run logs on the Google Cloud Platform with the ELK Stack.

You Might Also Like

Comparing Apache Hive vs. Spark

