
Docker Swarm Monitoring and Logging Using the ELK Stack
September 15, 2016
Docker Swarm is a native clustering management tool for Docker. Essentially, it turns a pool of Docker containers into one single, virtual Docker host. Swarm serves the standard Docker API, and any tool that already communicates with a Docker daemon can use Swarm to scale to multiple hosts transparently.
Properly monitoring the health of a distributed system is crucial to be able to identify and troubleshoot issues on time, but is also a challenge.
This guide describes how to establish a centralized logging architecture for a Swarm cluster by collecting event data (such as container status per nodes and container actions) and shipping them to the Logz.io ELK Stack (Elasticsearch, Kibana and Logstash).
These steps will explain how to create the Swarm cluster, prepare the nodes for logging, and track events using the Docker Swarm API.
Creating the Swarm cluster
Our first step is to create a Swarm cluster in a sandbox environment so that we can safely test the logging architecture. We will create a local cluster consisting of three virtual machines: one for the Swarm manager and two for additional cluster nodes.
To follow the next steps, make sure that you have Docker Toolbox, Docker Machine, and VirtualBox installed.
Before we begin, we have to stop any virtual machine that is running to avoid a conflict when creating and connecting the Swarm manager with the nodes. Use the docker-machine ls command to see if there are any machines running, and you should get this output:
NAME      ACTIVE   DRIVER       STATE     URL                         SWARM   DOCKER    ERRORS

        -   virtualbox    Running   tcp://:
To stop a running virtual machine, you can use:
docker-machine stop
Creating the cluster nodes
Once you’ve stopped the virtual machines, use the following command to create the Swarm manager that will be responsible for the entire cluster and in charge of managing the resources of all of the containers in the cluster:
docker-machine create --engine-env 'DOCKER_OPTS="-H unix:///var/run/docker.sock"' -d virtualbox manager
Our next step is to deploy the two additional cluster nodes (node-01 and node-02) by using a similar command to the one used for creating the Swarm manager.
For node-01:
docker-machine create --engine-env 'DOCKER_OPTS="-H unix:///var/run/docker.sock"' -d virtualbox node-01
For node-02:
docker-machine create --engine-env 'DOCKER_OPTS="-H unix:///var/run/docker.sock"' -d virtualbox node-02
Creating a discovery token
Our next step is to use the hosted discovery service on the Docker Hub to create a unique discovery token for the cluster, which we will then use to form the nodes into one cohesive cluster.
First, connect the Docker client to the manager:
eval $(docker-machine env manager)
Then, create a token for the Swarm cluster:
docker run --rm swarm create
Docker will now retrieve the latest Swarm image and run it as a container. The create argument instructs the Swarm container to connect to the Docker Hub discovery service using a unique Swarm ID (also known as a “discovery token.”) The token appears in the output, but it’s a good idea to save it for later use because it is not saved on file due to security considerations.
Enter the docker-machine ls command, and you will see a list of locally-running virtual machines. The output should look as follows:
NAME      ACTIVE   DRIVER       STATE     URL                         SWARM   DOCKER    ERRORS

node-01     -        virtualbox   Running   tcp://192.168.99.101:2376           v1.12.1

node-02     -        virtualbox   Running   tcp://192.168.99.102:2376           v1.12.1

manager     *        virtualbox   Running   tcp://192.168.99.100:2376           v1.12.1
Forming the cluster
We will now add the two nodes to the cluster, where a manager is responsible for the entire cluster.
First, connect to the manager using this command:
eval $(docker-machine env manager)
Next, we will enter the following command to run a Swarm container as the primary cluster manager (where is to be replaced by the desired port and will be replaced with the actual discovery token):
docker run -d -p :3376 -t -v /var/lib/boot2docker:/certs:ro swarm manage -H 0.0.0.0:3376 --tlsverify --tlscacert=/certs/ca.pem --tlscert=/certs/server.pem --tlskey=/certs/server-key.pem token://
To join node-01 to the cluster, use:
eval $(docker-machine env node-01)

docker run -d swarm join --addr=$(docker-machine ip node-01):2376 token://
To join node-02 to the cluster, use:
eval $(docker-machine env node-02)

docker run -d swarm join --addr=$(docker-machine ip node-02):2376 token://
Let’s review our cluster using this command:
DOCKER_HOST=$(docker-machine ip manager):3376
And then:
docker info
The output should look something like this:
Containers: 4

 Running: 4

 Paused: 0

 Stopped: 0

Images: 3

Server Version: swarm/1.2.5

Role: primary

Strategy: spread

Filters: health, port, containerslots, dependency, affinity, constraint

Nodes: 3

 manager: 192.168.99.100:2376

  └ ID: 2JFL:GTNS:H3AQ:DVNY:WAFU:22CJ:4ORL:FCIV:BR6X:3IRY:JAMC:WMBB

  └ Status: Healthy

  └ Containers: 2 (2 Running, 0 Paused, 0 Stopped)

  └ Reserved CPUs: 0 / 1

  └ Reserved Memory: 0 B / 1.021 GiB

  └ Labels: kernelversion=4.4.17-boot2docker, operatingsystem=Boot2Docker 1.12.1 (TCL 7.2); HEAD : ef7d0b4 - Thu Aug 18 21:18:06 UTC 2016, provider=virtualbox, storagedriver=aufs

  └ UpdatedAt: 2016-08-30T23:08:14Z

  └ ServerVersion: 1.12.1

 node-01: 192.168.99.101:2376

  └ ID: EYFN:67HB:ADNS:OU66:3HPG:7N35:63HD:CZUV:DBVV:O3V6:Y2OD:FSRT

  └ Status: Healthy

  └ Containers: 1 (1 Running, 0 Paused, 0 Stopped)

  └ Reserved CPUs: 0 / 1

  └ Reserved Memory: 0 B / 1.021 GiB

  └ Labels: kernelversion=4.4.17-boot2docker, operatingsystem=Boot2Docker 1.12.1 (TCL 7.2); HEAD : ef7d0b4 - Thu Aug 18 21:18:06 UTC 2016, provider=virtualbox, storagedriver=aufs

  └ UpdatedAt: 2016-08-30T23:08:55Z

  └ ServerVersion: 1.12.1

 node-02: 192.168.99.102:2376

  └ ID: OX2T:RABI:R6Z4:UVEA:UNRT:FYSK:MCR4:UACJ:DCGF:45RJ:7UCC:B5IM

  └ Status: Healthy

  └ Containers: 1 (1 Running, 0 Paused, 0 Stopped)

  └ Reserved CPUs: 0 / 1

  └ Reserved Memory: 0 B / 1.021 GiB

  └ Labels: kernelversion=4.4.17-boot2docker, operatingsystem=Boot2Docker 1.12.1 (TCL 7.2); HEAD : ef7d0b4 - Thu Aug 18 21:18:06 UTC 2016, provider=virtualbox, storagedriver=aufs

  └ UpdatedAt: 2016-08-30T23:08:55Z

  └ ServerVersion: 1.12.1

Plugins:

 Volume:

 Network:

Swarm:

 NodeID:

 Is Manager: false

 Node Address:

Security Options:

Kernel Version: 4.4.17-boot2docker

Operating System: linux

Architecture: amd64

CPUs: 3

Total Memory: 3.063 GiB

Name: 19cc2d2a80aa

Docker Root Dir:

Debug Mode (client): false

Debug Mode (server): false

WARNING: No kernel memory limit support
Collecting the event logs
Now, it starts to get interesting. Here, we will describe how to collect the machine logs generated by Swarm for subsequent forwarding into the ELK Stack for analysis.
Now, the –engine-env flag that we used above when creating and forming the cluster nodes already flagged which manager and agent nodes can use the UNIX socket for logging. Also, we used DOCKER_OPTS to enable logging per node.
Using these parameters enables us to get event information using the following command:
curl --unix-socket /var/run/docker.sock http:/events
It’s important to note that we’re using a UNIX socket to retrieve the log data. You can, if you like, use the Docker remote API as well. Check this guide to learn how to change and use the Remote API.
To see the logs of both of our cluster nodes, we need to use the following commands:
docker-machine ssh node-01 "curl -s --unix-socket /var/run/docker.sock http:/events"

docker-machine ssh node-02 "curl -s --unix-socket /var/run/docker.sock http:/events"
Next, open a new terminal window and connect the manager node with:
DOCKER_HOST=$(docker-machine ip manager):3376
Then, run:
docker run hello-world
You will get the following event data displayed:
{

  "status": "create",

  "id": "1fb46473d656c0433ad5eef39ba576192f0508a52dbfdf568a8a460edac0d569",

  "from": "hello-world",

  "Type": "container",

  "Action": "create",

  "Actor": {

    "ID": "1fb46473d656c0433ad5eef39ba576192f0508a52dbfdf568a8a460edac0d569",

    "Attributes": {

      "com.docker.swarm.id": "7eafc3e61c50e8eb26c09a8339e4238daae68786bafacbb4b7f192057de3725c",

    "image": "hello-world",

    "name": "thirsty_golick"

    }

  },

  "time": 1472601779,

  "timeNano": 1472601779555397191

}
Additional machine data that can be useful for logging containers can be retrieved using this command:
docker-machine ssh node-01 “curl -s --unix-socket /var/run/docker.socket http:/info”
In this case, the output returned will be much extensive, and will look as follows:
{
  "ID": "55G3:FDDK:OQSC:NYD7:GYHG:HR76:YZJQ:TITD:LKJD:NJ44:YE63:K7GI",
  "Containers": 20,
  "ContainersRunning": 1,
  "ContainersPaused": 0,
  "ContainersStopped": 19,
  "Images": 2,
  "Driver": "aufs",
  "DriverStatus": [
  [
    "Root Dir",
    "/mnt/sda1/var/lib/docker/aufs"
  ],
  [
    "Backing Filesystem",
    "extfs"
  ],
  [
    "Dirs",
    "44"
  ],
  [
    "Dirperm1 Supported",
    "true"
  ]
  ],
    "SystemStatus": null,
    "Plugins": {
    "Volume": [
    "local"
  ],
   "Network": [
   "null",
   "overlay",
   "host",
   "bridge"
  ],
  "Authorization": null
  },
  "MemoryLimit": true,
  "SwapLimit": true,
  "KernelMemory": true,
  "CpuCfsPeriod": true,
  "CpuCfsQuota": true,
  "CPUShares": true,
  "CPUSet": true,
  "IPv4Forwarding": true,
  "BridgeNfIptables": true,
  "BridgeNfIp6tables": true,
  "Debug": true,
  "NFd": 20,
  "OomKillDisable": true,
  "NGoroutines": 35,
  "SystemTime": "2016-08-31T01:01:31.661787637Z",
  "ExecutionDriver": "",
  "LoggingDriver": "json-file",
  "CgroupDriver": "cgroupfs",
  "NEventsListener": 1,
  "KernelVersion": "4.4.17-boot2docker",
  "OperatingSystem": "Boot2Docker 1.12.1 (TCL 7.2); HEAD : ef7d0b4 - Thu Aug 18 21:18:06 UTC 2016",
  "OSType": "linux",
  "Architecture": "x86_64",
  "IndexServerAddress": "https://index.docker.io/v1/",
  "RegistryConfig": {
    "InsecureRegistryCIDRs": [
    "127.0.0.0/8"
  ],
  "IndexConfigs": {
    "docker.io": {
      "Name": "docker.io",
      "Mirrors": null,
      "Secure": true,
      "Official": true
    }
  },
  "Mirrors": null
  },
  "NCPU": 1,
  "MemTotal": 1044238336,
  "DockerRootDir": "/mnt/sda1/var/lib/docker",
  "HttpProxy": "",
  "HttpsProxy": "",
  "NoProxy": "",
  "Name": "node-01",
  "Labels": [
    "provider=virtualbox"
  ],
  "ExperimentalBuild": false,
  "ServerVersion": "1.12.1",
  "ClusterStore": "",
  "ClusterAdvertise": "",
  "SecurityOptions": [
  "seccomp"
  ],
  "Runtimes": {
  "runc": {
    "path": "docker-runc"
    }
  },
  "DefaultRuntime": "runc",
  "Swarm": {
    "NodeID": "",
    "NodeAddr": "",
    "LocalNodeState": "inactive",
    "ControlAvailable": false,
    "Error": "",
    "RemoteManagers": null,
    "Nodes": 0,
    "Managers": 0,
    "Cluster": {
      "ID": "",
      "Version": {
    },
    "CreatedAt": "0001-01-01T00:00:00Z",
    "UpdatedAt": "0001-01-01T00:00:00Z",
    "Spec": {
      "Orchestration": {
      },
      "Raft": {
      },
      "Dispatcher": {
      },
      "CAConfig": {
      },
      "TaskDefaults": {
      }
    }
  }
 },
  "LiveRestoreEnabled": false
}
For a complete list of Docker Swarm events that can logged using APIs, check out the Docker docs.
Using the commands above, we can retrieve event logs for any of the nodes in our Swarm cluster.
We want this data to be shipped into ELK, so our next step is to output these events into files using the following commands:
docker-machine ssh node-01 "curl -s --unix-socket /var/run/docker.sock http:/events" >> /example/path/node-01_events.log

docker-machine ssh node-02 "curl -s --unix-socket /var/run/docker.sock http:/events" >> /example/path/node-02_events.log
Of course, retrieving logs from the nodes can also be automated by using cron jobs or customized schedules.
Shipping the event logs into ELK
There are a number of methods for shipping the Swarm event logs into ELK. This section will outline two of them: AWS S3 buckets and Logstash. Please note: The configurations here are optimized for shipping to the ELK Stack that hosted by Logz.io. If you are using your own ELK instance, you should use the Logstash method and apply changes to the configuration file.
Using AWS S3
Using the AWS CLI sync command, you can sync your local storage easily:
aws s3 sync /example/path s3://swarm-logs/$(date +"%Y-%m-%d-%H")
We have set the date here to group and store the logs on S3 based on their timestamps.
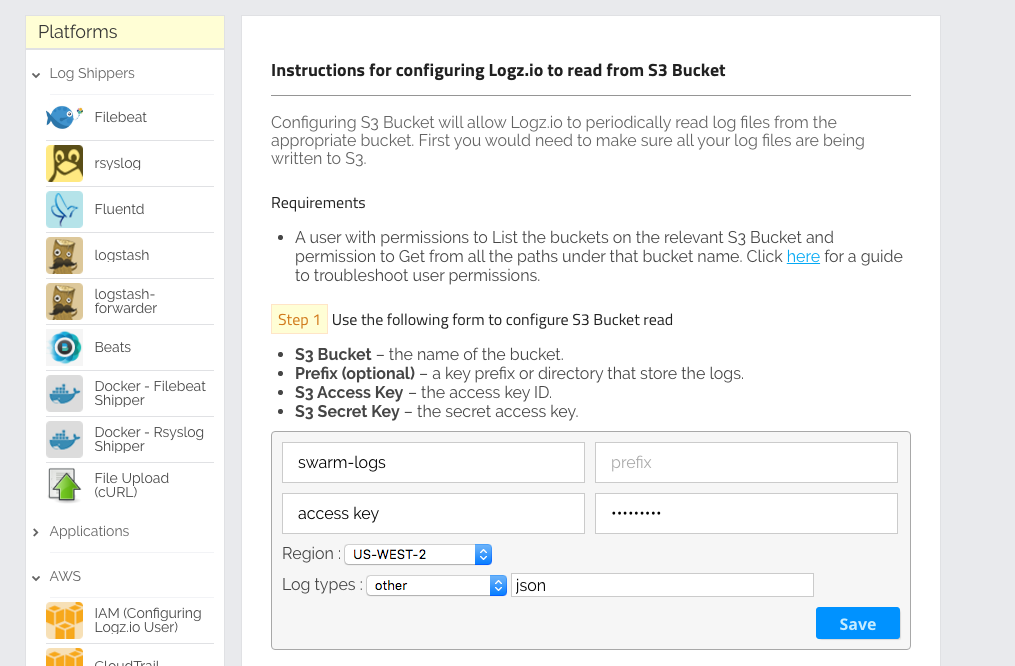
Once synced with S3, we need to configure shipping from the S3 buckets in the Logz.io Log Shipping section.
As shown below, after clicking on the Log Shipping item and selecting “S3 Bucket” from the “AWS” drop-down box, you will see the fields that you need to fill out to run the service properly. The required fields are the bucket names — in this case, the swarm logs, an S3 access key, and a secret key that you should have received from AWS.
Using Logstash
As explained above, this shipping option is obviously better if you’re using your own ELK Stack (and the guide below presumes that you have the stack installed already).
Open the Logstash configuration file and configure Logstash to track the Swarm event files that we have created. The Filter section, in this case, includes
the user token for shipping to Logz.io — so, if you’re using your own Logstash, you can remove this section. Also, in the output section, enter your Elasticsearch host IP instead of the Logz.io listener:
input {

  file {

    path => "/example/path/*_events.log"

    start_position => "beginning"

    type => "events"

  }

  file {

    path => "/example/path/*_info.log"

    start_position => "beginning"

    type => "info"

  }

}

filter {

  mutate {

    add_field => { "token" => "XmQHXXBnvNXanECxefFmNejREliRJmaW" }

  }

}

output {

  tcp {

    host => "listener.logz.io"

    port => 5050

    codec => json_lines

  }

}
Last but not least, start Logstash while passing the configuration file above as an argument:
bin/logstash -f logstash-docker-swarm.conf
Building a Kibana dashboard
Our final step is to begin to analyze the logs. As an example of how to use Kibana to visualize Swarm events logs, we will describe how to create a dashboard to monitor the containers in the cluster.
Number of containers over time
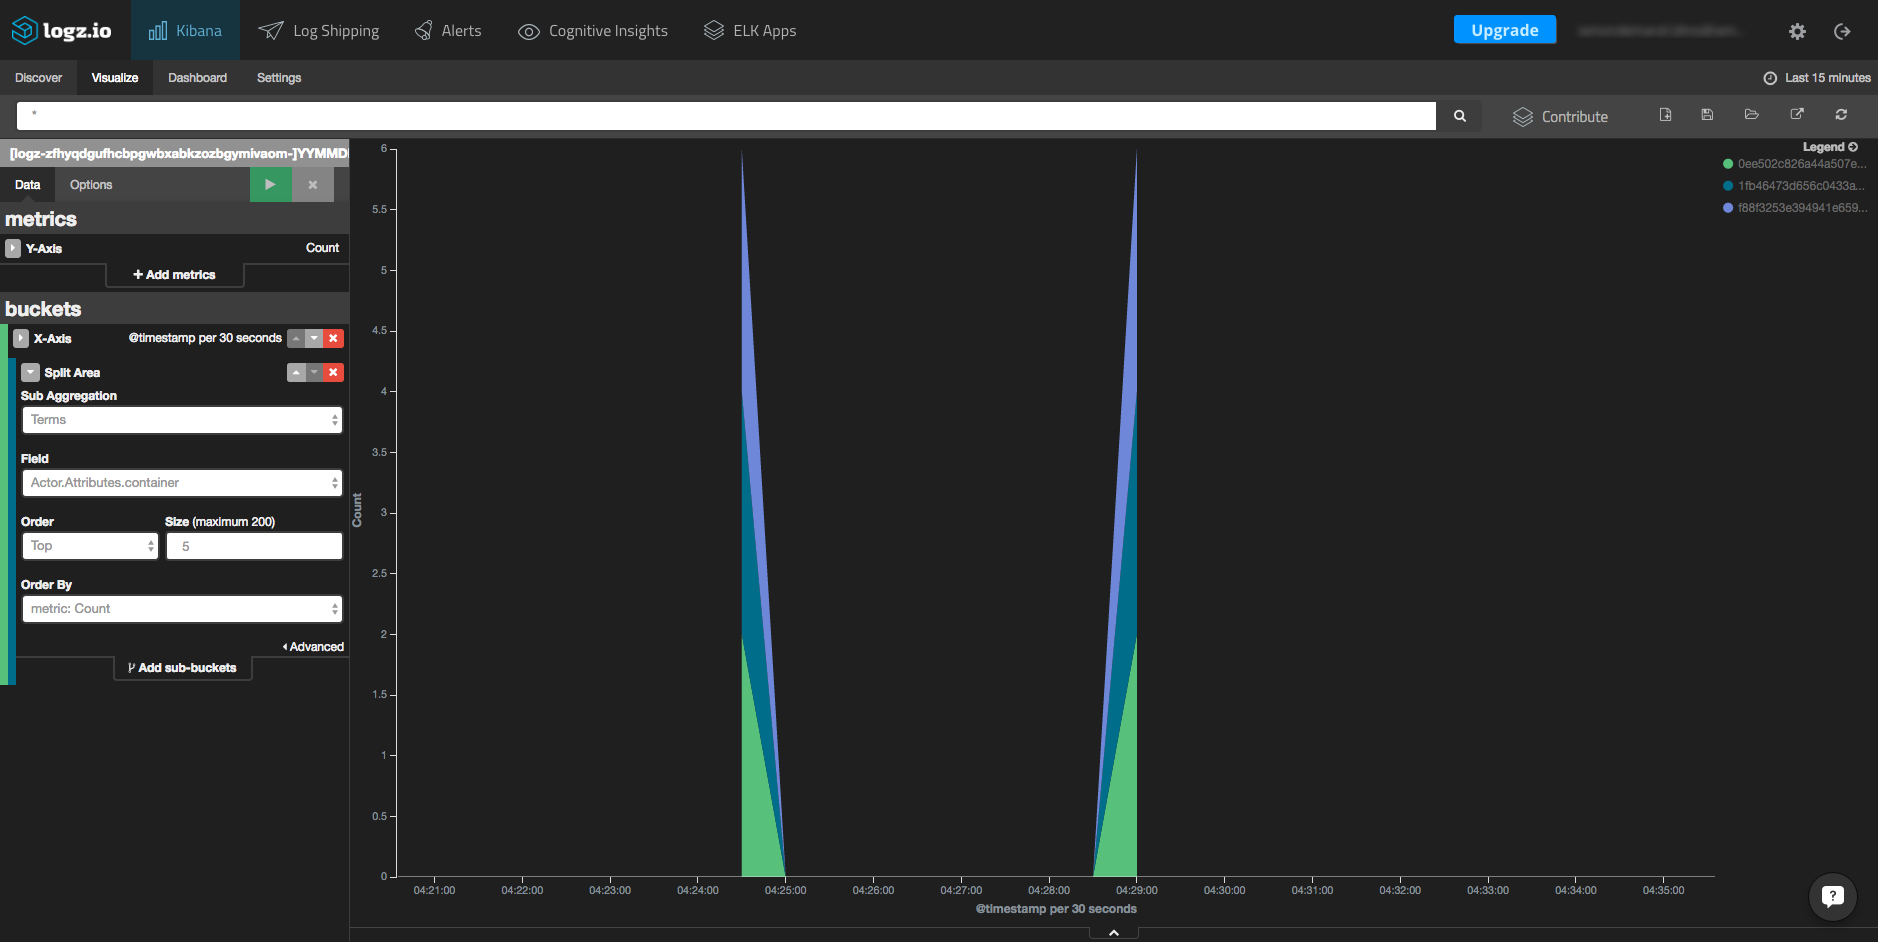
The first chart that we will create is an area chart that is displayed in a histogram that shows the number of containers over time.
To create the chart, click the “Visualize” tab in Kibana and select the area chart visualization type from the menu. Then, in the left-hand box under the “Data” tab, use the X-axis as a date histogram and under “Split Area,” select “Terms” as a sub-aggregation. As a field, select Actor.Attributes.container.
You can also specify the size of the items that will be taken in the query. After hitting the green button above the settings box, you will see the result chart (note the configuration on the left):
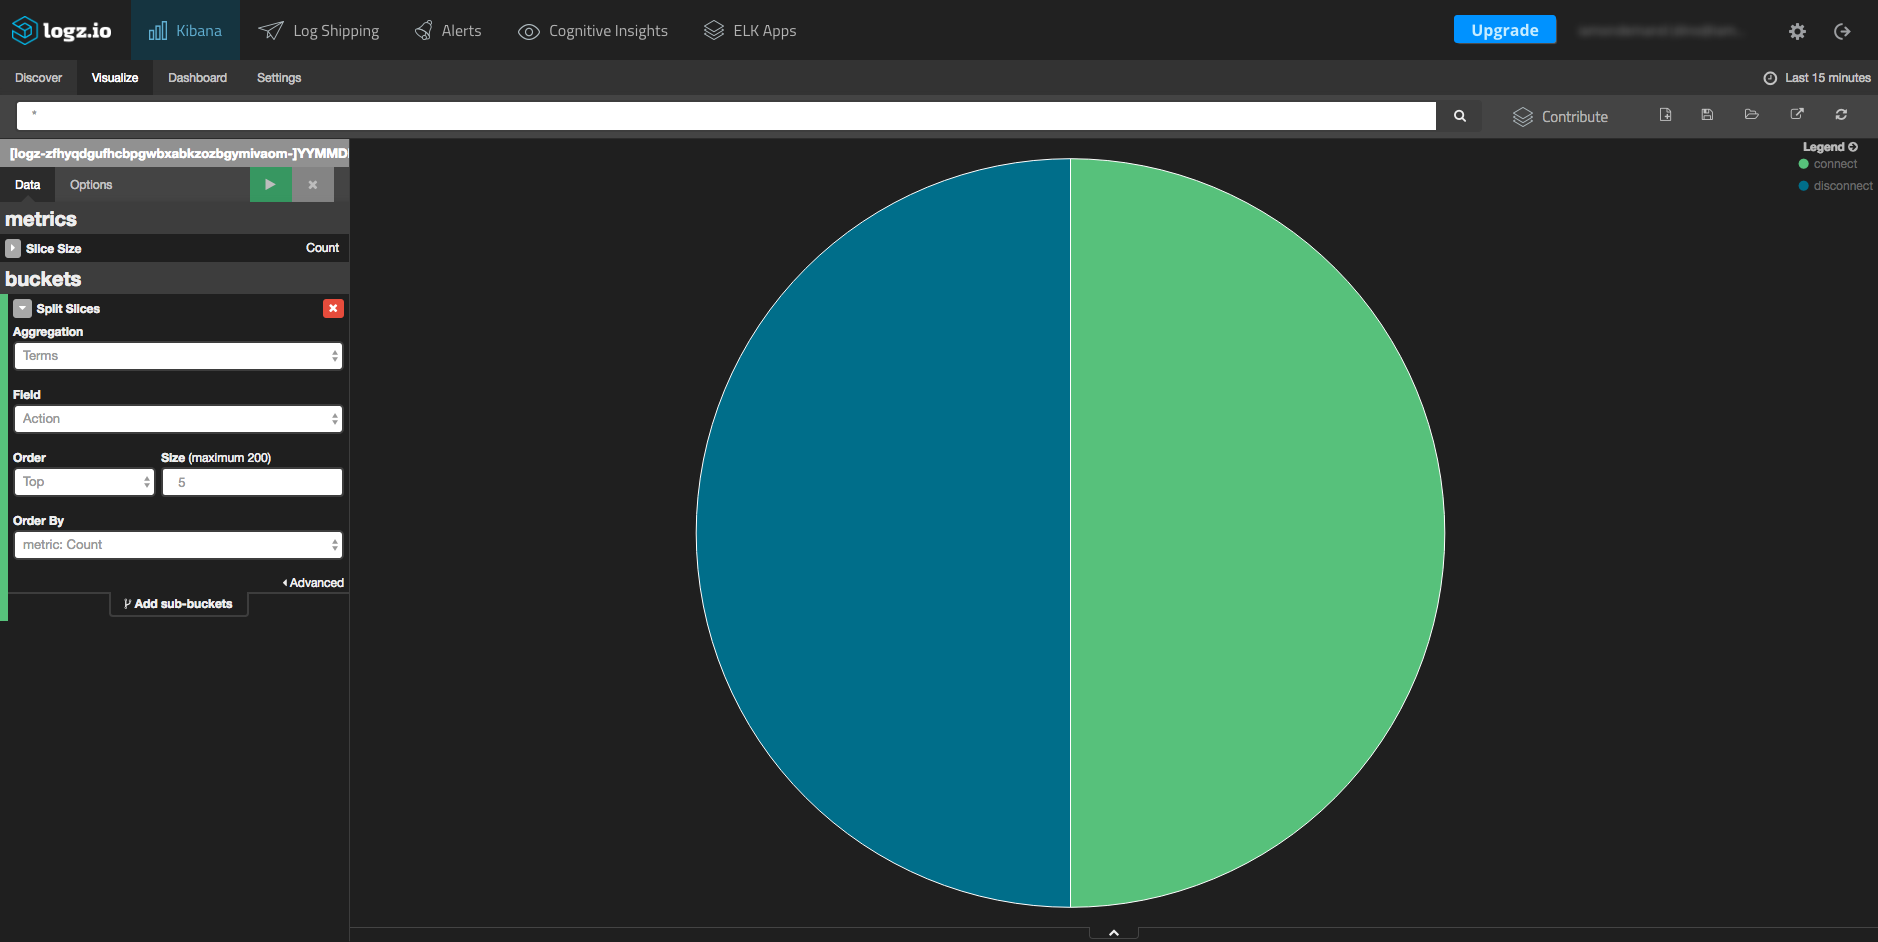
Distribution of actions
In this visualization, we can view all of the various Swarm actions (for example, pull, commit, create, connect, and disconnect).
Again, click the “Visualize” tab in Kibana and this time, select the pie chart visualization type. On the left-hand side, you will have to select the “Action” field from the aggregation drop-down menu.
After hitting the green button above the settings box, you will see this resulting chart:
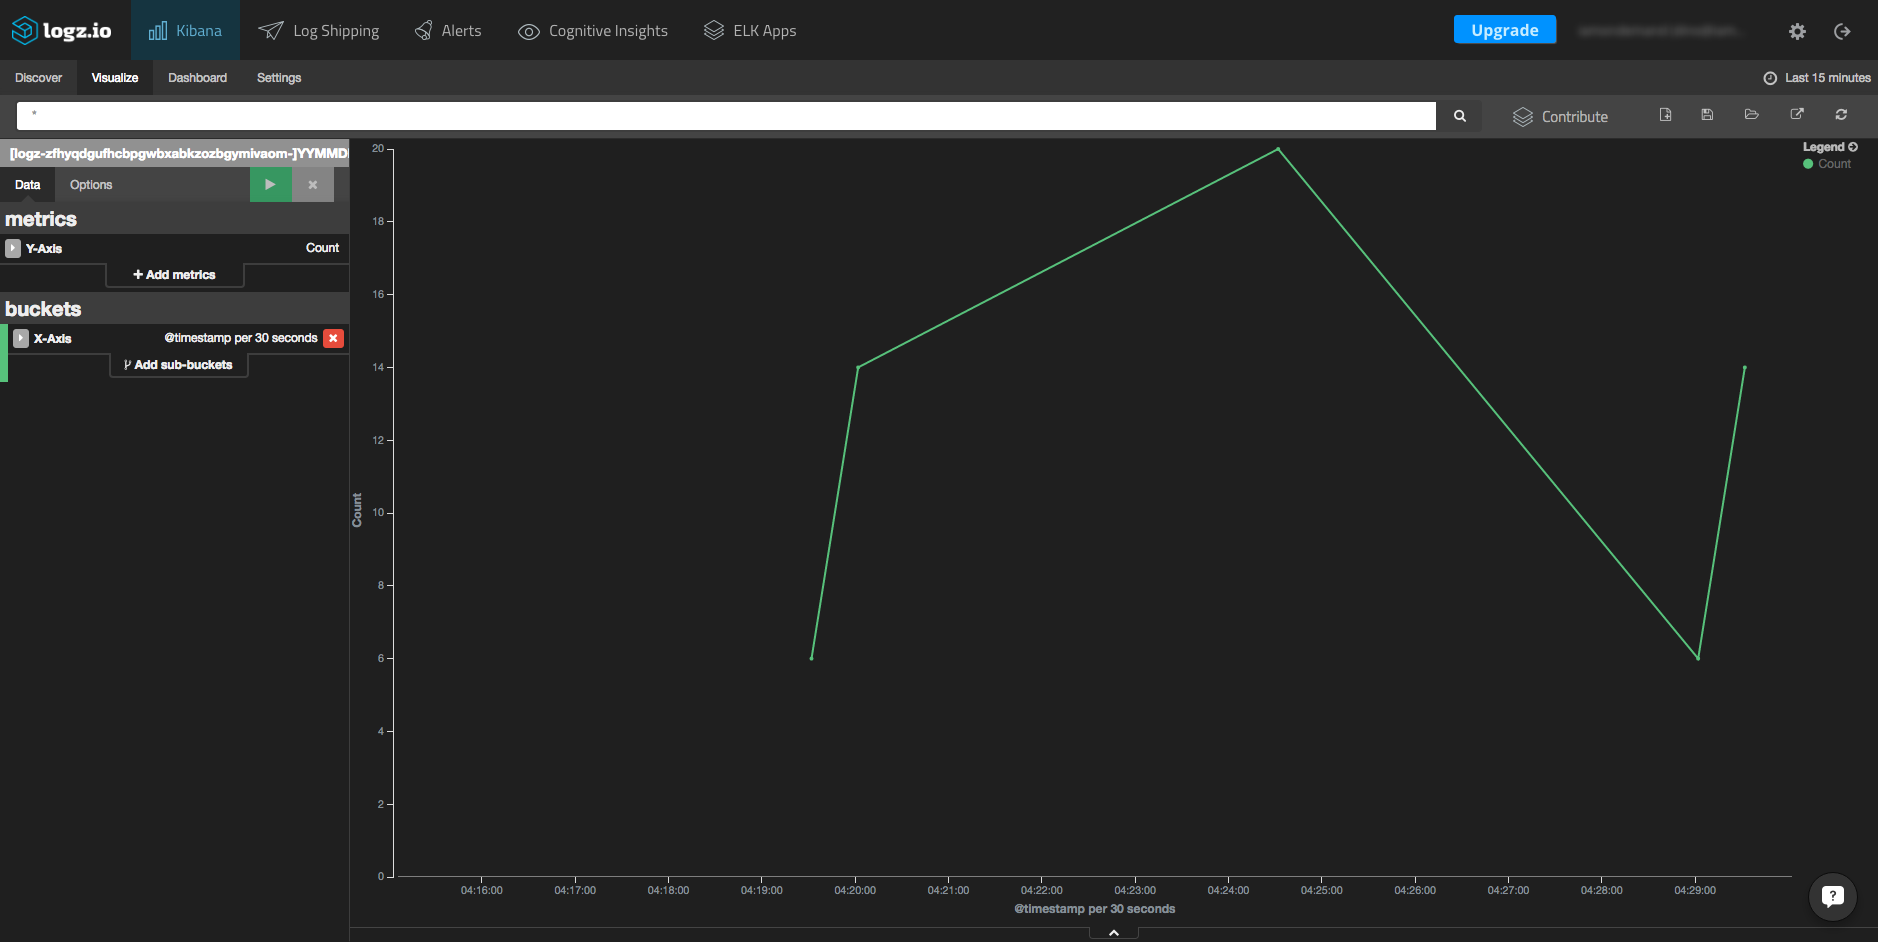
Swarm event logs over time
Another example of how to visualize Docker Swarm event logs is to create a line chart that displays logs over time. Here is the configuration, and an example, of the resulting visualization:
Creating a dashboard
Once you’ve created a series of visualizations, you can put them all together in a comprehensive dashboard. This allows you to monitor your Swarm cluster from a single place.
Creating a dashboard is simple — simply select the “Dashboard” tab in Kibana and manually add each visualization to create something like this:
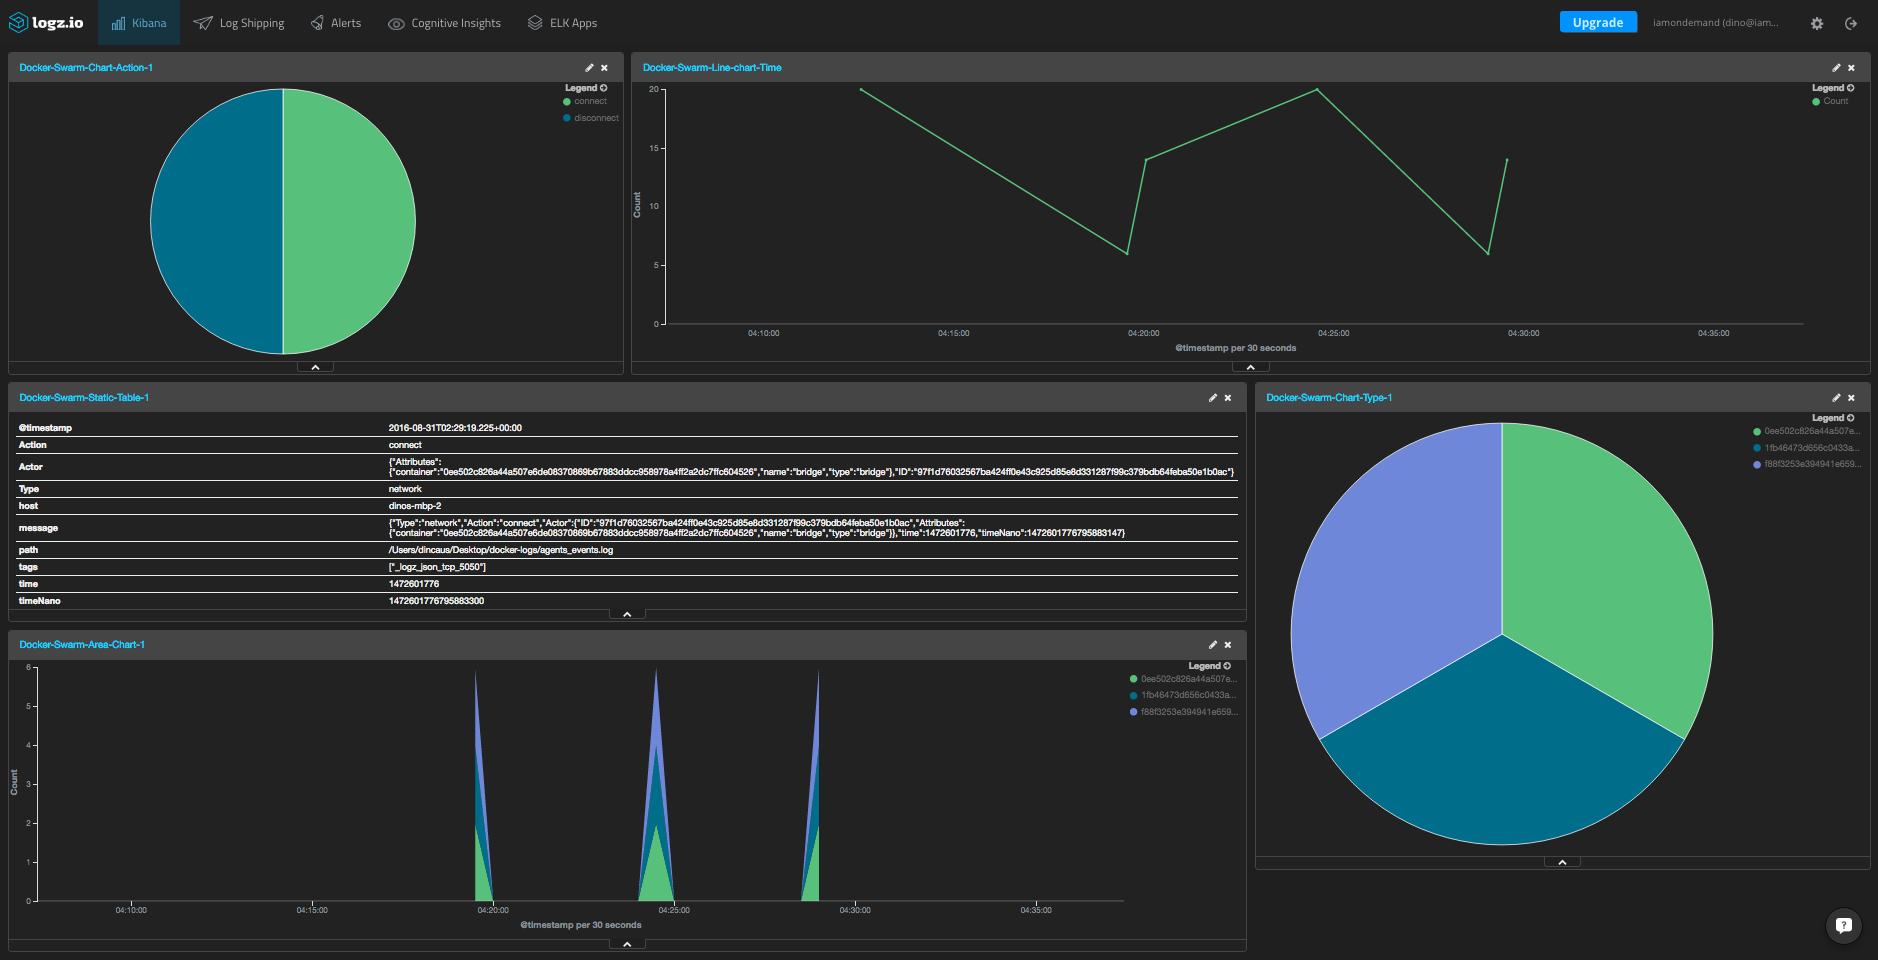
If you’re using Logz.io, this dashboard is available in our ELK Apps library of pre-made dashboards and visualizations, so you can easily install it here with one click.
Summary
Docker Swarm is a great tool for building and managing a Docker clustered environment, but it is critical to know what is going on inside the cluster to be able to make sure that everything is functioning as expected.
More on the subject:
Being able to monitor the cluster will enable you to identify whenever something is going wrong with your services by providing you with a clear picture of the events taking place within Swarm in real time.
Of course, this guide outlined our recommended method for logging Swarm with ELK, but you can create and deploy your own ELK Stack and configure the shipping however you wish.
We’d love to hear how you’re handling logging for Docker Swarm — leave a comment below.

You Might Also Like

Observability Across the Development Lifecycle: A Convo with Andre Boutet of OneSpan

