
How to Deploy the ELK Stack in Production
Log management has become a must-do action for every organization to resolve problems and ensure that applications are running in a healthy manner. As such, log management has become a mission-critical system.
When you’re troubleshooting a production issue or trying to identify a security hazard, the system must be up and running around the clock. Otherwise, you won’t be able to troubleshoot or resolve issues that arise — potentially resulting in performance degradation, downtime or security breach. Log analytics that runs continuously can equip you with the means to track and locate the specific issues that are wreaking havoc on your system.
More on the subject:
The ELK Stack (a.k.a., Elasticsearch, Logstash, and Kibana) is one of the largest-growing, open-source log management platforms — plus, it comes with a vibrant community! ELK’s rapid growth is demonstrated by its adoption by huge companies such as Netflix and Bloomberg. In this article, I will use our experiences in building Logz.io to introduce the challenges as well as offer some guidelines in building a production-grade ELK deployment.

Overall, ELK implementation needs to:
- Save and index all of the log files that it receives (sounds obvious, right?)
- Operate when the production system is overloaded or even failing (because that’s when most issues occur, isn’t it?)
- Keep the log data protected from unauthorized access
- Have maintainable approaches to data retention policies, upgrades, and more
Don’t Lose Log Data
If you are troubleshooting an issue and go over a set of events, it only takes missing one log line to get incorrect results. Every log event must be captured. For example, you’re viewing a set of events in MySQL that ends with a database exception. If you lose one of the events, it might be impossible to pinpoint the cause of the problem.
Use Redis
![]()
Place a Redis server in front of your Logstash machine that will be the entry point for all log events that are shipped to your system. It will then buffer the data until the downstream components have enough resources to index. Elasticsearch is the engine at the heart of ELK. It is very susceptible to load, which means you need to be extremely careful when indexing and increasing your amount of documents. When Elasticsearch is busy, Logstash works slower than normal — which is where Redis comes in, accumulating more documents that can then be pushed to Elasticsearch. This is critical not to lose log events.
See the suggested architecture below:
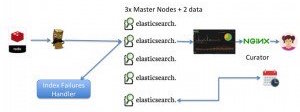
Keep Track of Logstash/Elasticsearch Exceptions
Logstash may fail when it tries to index logs to Elasticsearch that can’t fit into the automatically-generated mapping. For example, let’s say you have a log entry that looks like this:
Timestamp=time, type=my_app, error=3,….
And later, the system generates a similar log:
Timestamp=time, type=my_app, error=”Error”,….
In the first case, a number is used. In the second case, a string is used. As a result, Elasticsearch will NOT index the document — it will just return a failure message and the log will be dropped. To make sure that such logs are still indexed, you need to:
- Use the “Type” field for each type of log. “Type” is somewhat similar to an SQL table. For a given “type,” a field can have one schema (integer OR string).
- Work with developers to make sure they’re keeping log formats consistent. If a log schema change is required, just change the “Type” field according to the type of log.
- Ensure that Logstash is consistently fed with information and monitors Elasticsearch exceptions to ensure that logs are not shipped in the wrong formats. Using mapping that is fixed and less dynamic is probably the only solid solution here (that doesn’t require you to start coding).
At Logz.io, we solve this problem by building a pipeline to handle mapping exceptions that eventually index these documents in manners that don’t collide with existing mapping.
Keep Up with Growth and Bursts

Machines pile up, data grows, and log files follow suit. As you scale out with more products, applications, features, developers, and operations, you also accumulate more logs. This requires a certain amount of compute resource and storage capacity so that your system can process all of them. In general, log management solutions consume large amounts of CPU, memory, and storage. Log systems are bursty by nature, and sporadic bursts are typical. If a file is purged from your database, the frequency of logs that you receive may range from 100 to 200 to 100,000 logs per second. As a result, you need to allocate up to 10 times more capacity than normal. When there is a real production issue, many systems generally report failures or disconnections, which cause them to generate many more logs. This is actually when log management systems are needed more than ever.
ELK Elasticity
One of the biggest challenges of building an ELK deployment, then, is making it scalable. Let’s say you have an e-commerce site and experience an increasing number of incoming log files during a particular time of year. To ensure that this influx of log data does not become a bottleneck, you need to make sure that your environment can scale with ease. This requires that you scale on all fronts — from Redis to Logstash and Elasticsearch — which is challenging in multiple ways. Regardless of where you’re deploying your ELK platform — be it on Amazon Web Services, in the Google Cloud, or in your own datacenter — we recommend having a cluster of Elasticsearch nodes that run in different availability zones, or in different segments of a datacenter, to ensure high availability.
Let’s discuss it one component at a time.
Redis
You probably want to run more than one Redis server, an action that requires some work. You can either build it on your own or run Redis Labs as a service. The only challenge is dividing inbound log traffic from UDP/TCP across multiple Redis servers. For this, we use AWS Route 53 and will share some more about this in the future.
Logstash
To read and push to Elasticsearch, it’s best to use a Logstash instance for each Redis server. That’s easy. Each one of your Logstash instances should run in a different AZ (on AWS). You should also separate Logstash and Elasticsearch by using different machines for them. This is critical because they both run as JVMs and consume large amounts of memory, which makes them unable to run on the same machine effectively. I also recommend allocating half of the memory on each machine to Elasticsearch or Logstash.
Cluster Elasticsearch
Elasticsearch is composed of a number of different components, two of which are the most important: the master nodes and the data nodes. The master nodes are responsible for cluster management while the data nodes, as the name suggests, are in charge of the data. We recommend clustering Elasticsearch with at least three master nodes because of the common occurrence of split brain, which is essentially a dispute between two nodes regarding which one is actually the master. As a result, using three master nodes prevents split-brain from happening. As far as the data nodes go, we recommend having at least two data nodes so that your data is replicated at least once. This results in a minimum of five nodes: the three master nodes can be small machines, and the two data nodes need to be scaled on solid machines with very fast storage and a large capacity for memory.
A quick note about AWS: Since multicast doesn’t work with AWS, Elasticsearch’s cluster discovery protocol will not work. You need to install the Elasticsearch AWS plugin or configure unicast cluster discovery.
Run in Different AZs (But Not in Different Regions)
We recommend having your Elasticsearch nodes run in different availability zones or in different segments of a datacenter to ensure high availability. This can be done through the Elasticsearch setting that allows you to configure every log to be replicated between different AZs.
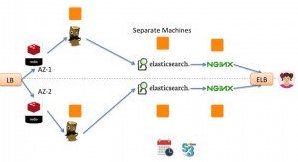
While it may seem odd, we don’t recommend running Elasticsearch clusters across AWS regions. Due to the increased latency that is experienced when synchronizing data between regions, it doesn’t work well… — at least according to the tests we have done.
Here is a suggested architecture to run ELK on multiple AZs or multiple separated data centers:
Protect the Environment

Access Control
Due to the fact that logs may contain sensitive data, it is crucial to protect who can see what. How can you limit access to specific dashboards, visualizations, or data inside your log analytics platform? As far as we know, there is no simple way to do this in the ELK Stack. One option is to use the Nginx reverse proxy to access your Kibana dashboard, which entails a simple nginx configuration that requires those who want to access the dashboard to have a username and password. This quickly blocks access to your Kibana console.
The challenge here arises if you would like to limit access on a more granular level. This is currently impossible within open source ELK. The only thing you can do is use Elasticsearch Shield and build the security from Elasticsearch up the stack. At Logz.io, we take a different approach that allows for role-based access.
Last but not least, be careful when exposing Elasticsearch because it is very susceptible to attacks. We recommend limiting all access to Elasticsearch inbound port 9200 from the internet.
Maintainability
Log Data Consistency
Logstash has a component that parses logs and tokenizes them in accordance with a set of rules. Therefore, if you have an access log from nginx, you want the ability to view each field and have visualizations and dashboards built based on specific fields. You need to apply the relevant parsing abilities to Logstash — which has proven to be quite a challenge, particularly when it comes to building groks, debugging them, and actually parsing logs to have the relevant fields for Elasticsearch and Kibana.
At the end of the day, it is very easy to make mistakes using Logstash, which is why you should carefully test and maintain all of your log configurations by means of version control. That way, while you may get started using nginx and MySQL, you may incorporate custom applications as you grow that result in large and hard-to-manage log files. The community has generated a lot of solutions around this topic, but trial and error is extremely important with open source tools before using them in production. See our Logstash tutorial and learn more about Logstash pitfalls and how to avoid them.
Data Retention
Another aspect of maintainability comes into play with excess indices. Depending on how long you want to retain data, you need to have a process set up that will automatically delete old indices — otherwise, you will be left with too much data and your Elasticsearch will crash, resulting in data loss. To prevent this from happening, you can use Elasticsearch Curator to delete indices. We recommend having a cron job that automatically spawns Curator with the relevant parameters to delete any old indices, ensuring you don’t end up holding too much data. It is commonly required to save logs to S3 in a bucket for compliance, so you want to be sure to have a copy of the logs in their original format. Copying should be done before logs are parsed by Logstash.
Upgrades
Performing Elasticsearch upgrades can be an endeavor on its own. First and foremost, you don’t want to lose any data in the lengthy process. New versions are released every few weeks, so pay careful attention to the upgrade process if you choose to go that route. Make sure you have at least one replication on Elasticsearch and perform warm upgrades (sync data and upgrade one node at a time).
Logstash upgrades are generally easier, but pay close attention to the compatibility between Logstash and Elasticsearch.
Kibana upgrades are hard, but possible. Kibana 3 does not have an upgrade path to Kibana 4. We’ve just met a user who has 600 different Kibana 3 dashboards and now has to rewrite them to use Kibana 4. I guess that’s one of the drawbacks of free open-source solutions.
![]()
Summary
Getting started with ELK to process logs from a server or two is easy and fun. Like any other production system, it takes much more work to reach a solid production deployment. We know this because we’ve been working with many users who struggle with making ELK operational in production.
At Logz.io, we help users resolve operational problems faster by identifying the one event that matters in log files out of the millions that are meaningless. We have been hard at work developing innovative technologies that process through an entire system’s logs in real time and finds events that have negative impacts on the environment. This technology runs on top of an enterprise-grade ELK as a service. Our customers get production-grade ELK ready in minutes — from alerts to advanced security to infinite elasticity to high availability.

You Might Also Like

Data Optimization Hub

How to Create Cost-Effective Infrastructure Monitoring
Get started for free
Completely free for 14 days, no strings attached.
