Fighting Alert Fatigue: Introducing Full Alert Customization in Logz.io
September 5, 2017

Alert Fatigue is one of the biggest challenges facing DevOps teams today. Large amounts of signals and alerts being triggered make it impossible to see the forest for the trees. One of the methods for overcoming this challenge is properly formatted and well-structured alerts.
While log-based alerts tend to be more accurate since they are based on actual output collected from running processes in your system, they can still be pretty verbose in nature. In an ideal world, our log messages would contain only the data that interests us but is many cases they will contain a long list of fields and corresponding values. As a result, alerts can end up looking like an endless JSON message.
Logz.io’s built-in alerting mechanism now allows you to fully customize log-based alerts in Kibana. You decide what fields to see in your alert and how they are displayed, and all this within an easy-to-consume table format that can be sent to you by either email or Slack (other endpoints to be supported in the future).
Let’s take a closer look.
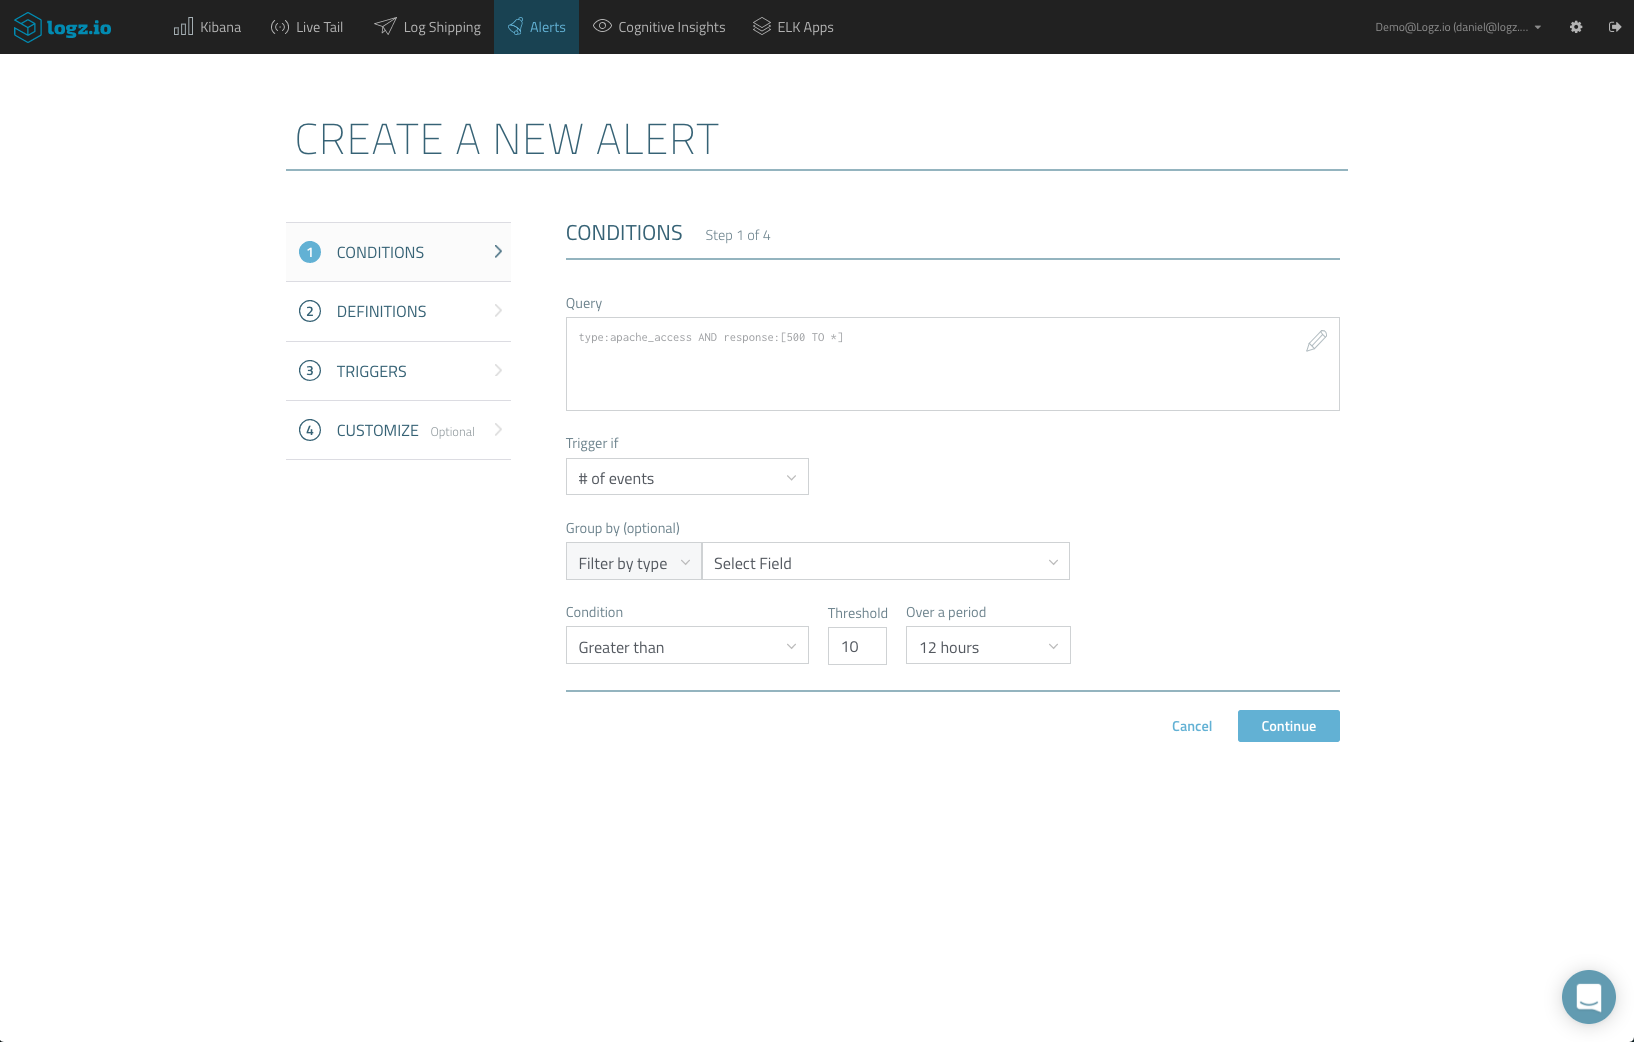
As an example, let’s say you are monitoring Apache access logs. You wish to be alerted on abnormal server errors. In Logz.io, you would use this query to search your logs:
type:apache_access AND response:[500 TO *]
Creating an alert based on this Kibana query, you will first define the trigger for the alert:
You will then be required to give your alert a name and description, and define the list of recipients for the alert. This can be a list of email addresses or an alert endpoint, such as Slack, PagerDuty, Datadog, etc. More on the subject:
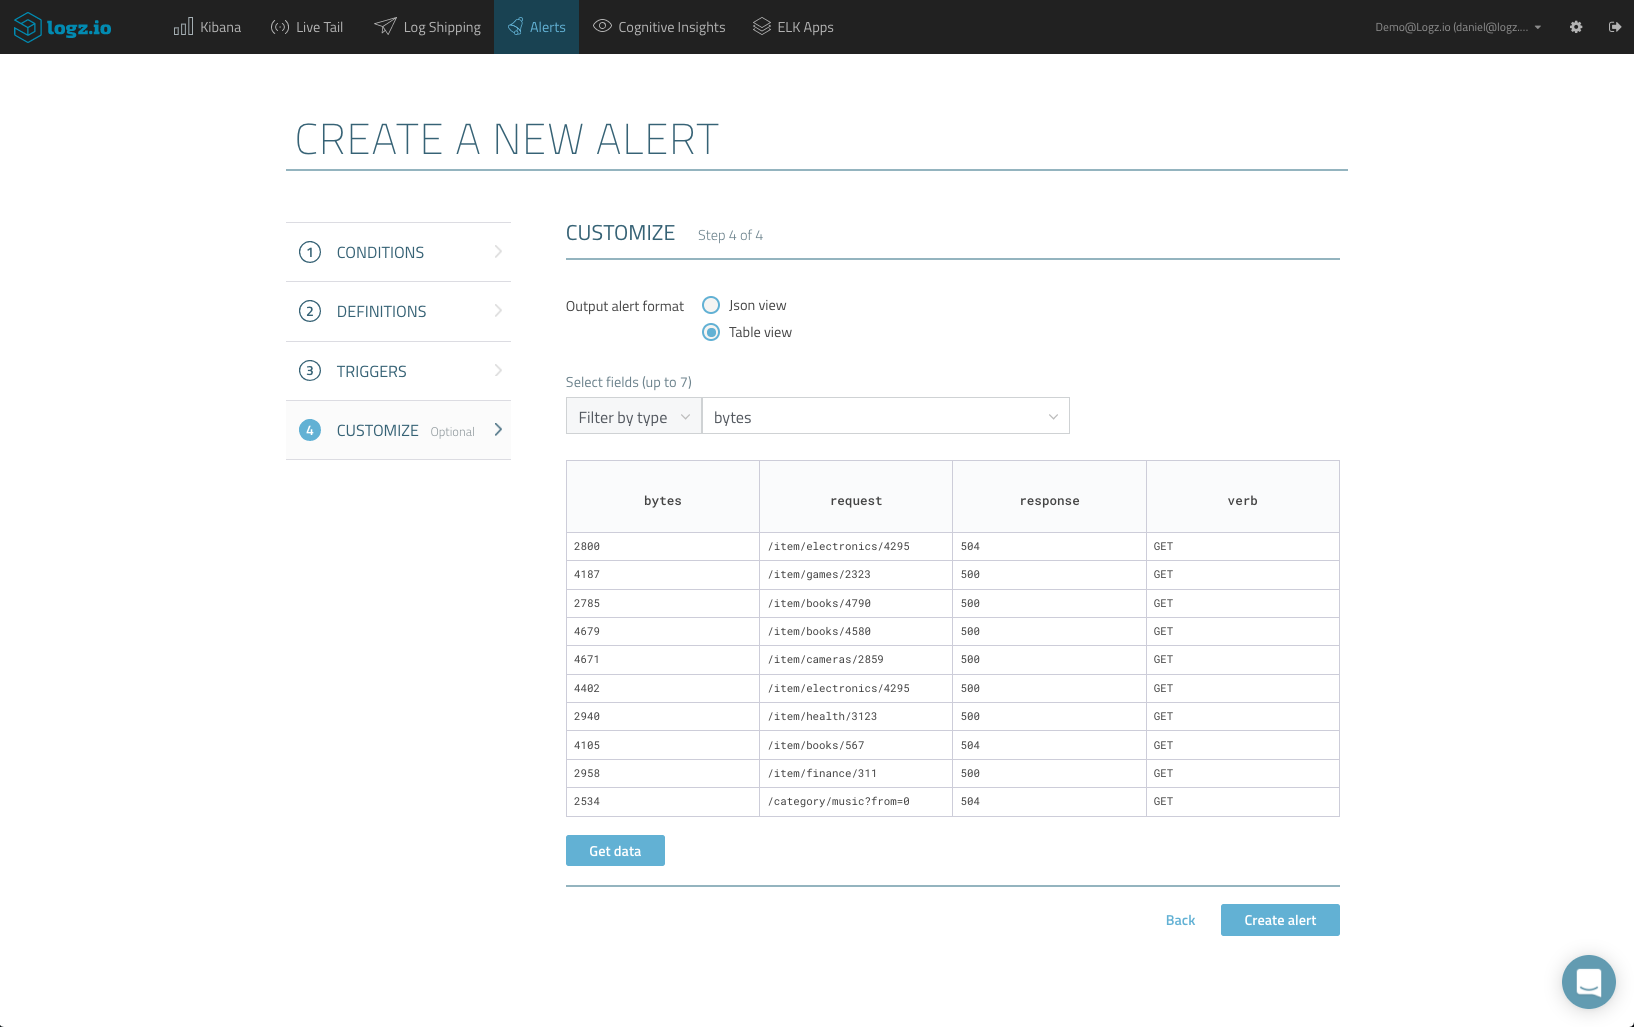
The new Customize step allows you to choose the alert format, either JSON view (selected by default) or Table view. Selecting the latter opens up customization options for the alert and you can now start designing what alert will look like.
First, select up to 7 fields for a specific log type. In our case for example, I want to see values for the response, bytes, request and verb fields. The table is automatically filled as you add fields, and you can hit the Get Data button to refresh the data.
Of course, not all the logs can be displayed here, but the table will show up to 10 samples of the corresponding log messages.
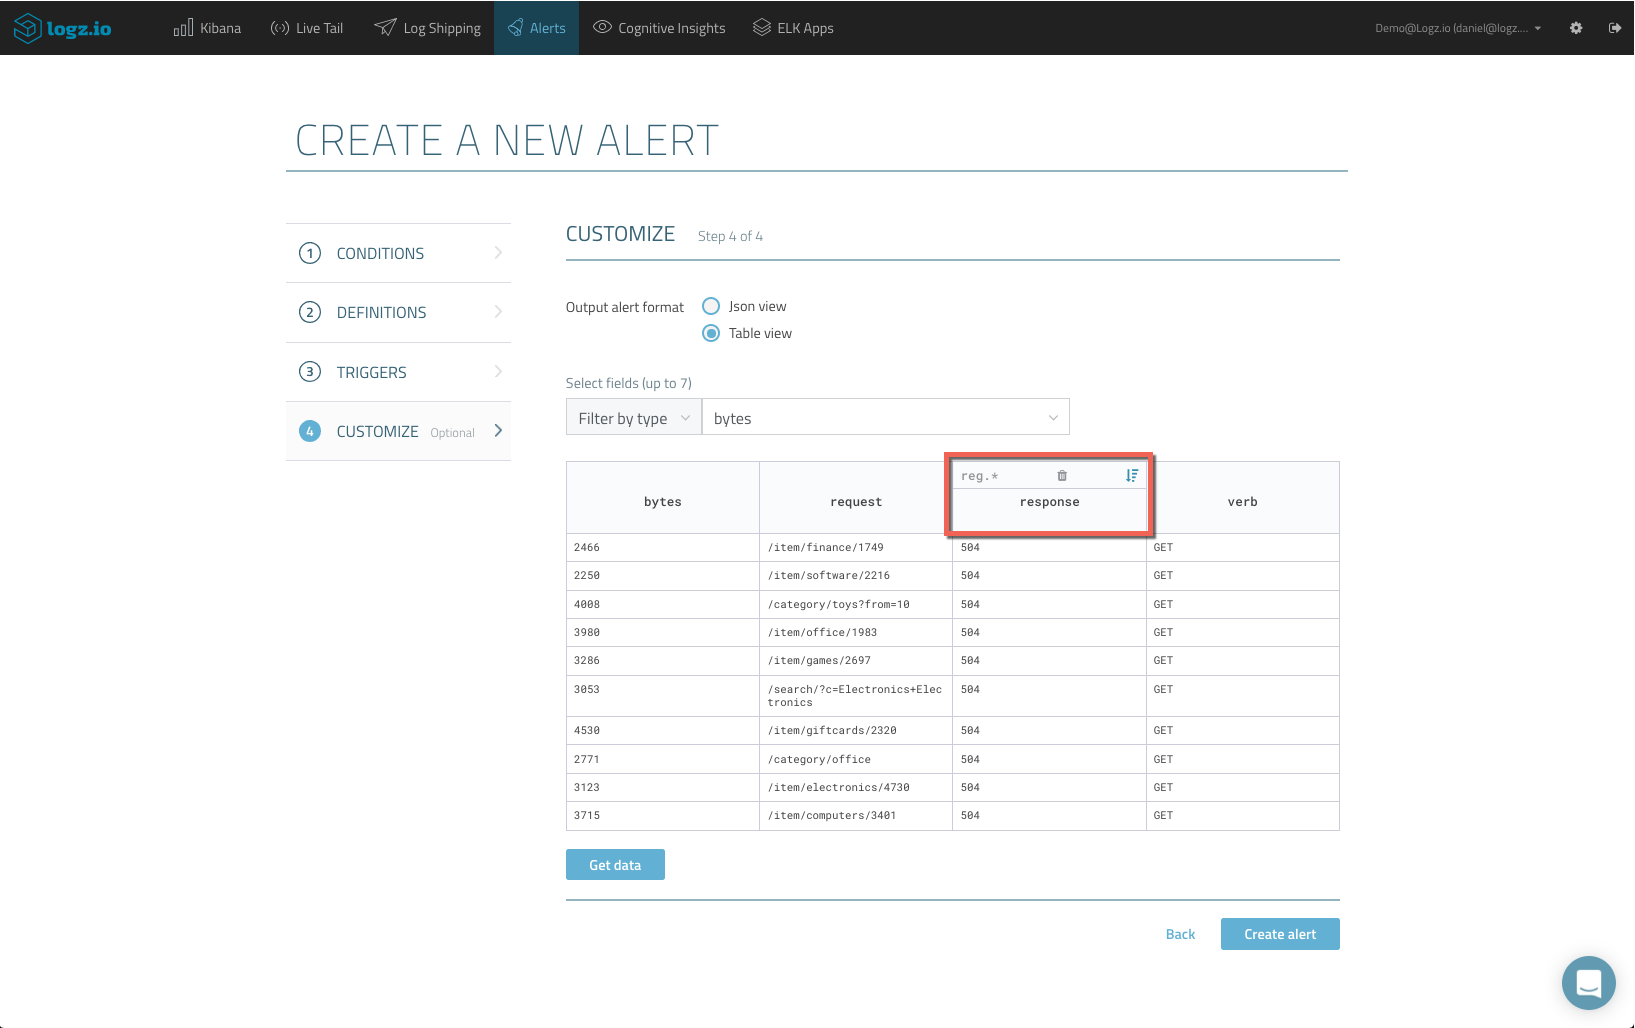
As you hover over the different fields you’ve added to the table, additional customization options are revealed.
You can use a REGEX pattern to filter out unwanted pieces of data within long textual fields, while the sort option allows you to control the order in which your 10 sample logs will be displayed in the alert.
Define the order in which the samples shown in the alert are displayed. Of course, you have the option of removing unwanted columns as well.
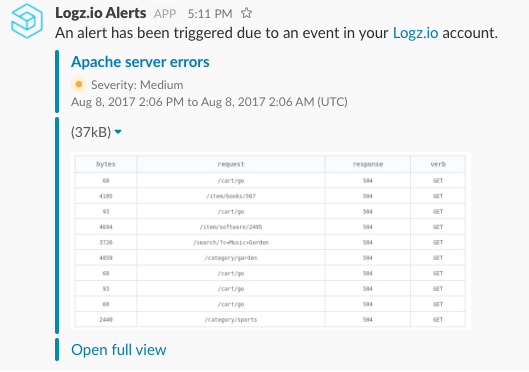
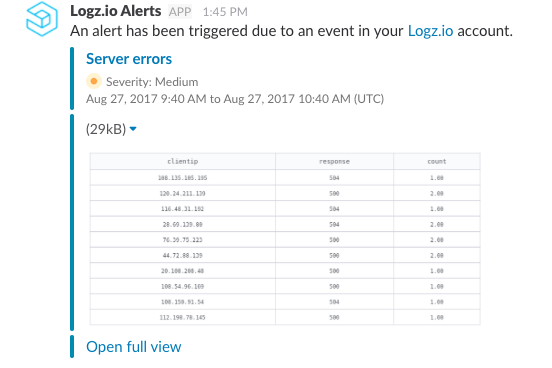
Once saved, the Logz.io alerting engine comes into action and verified the conditions defined in your alert. If these are met, an alert is triggered, and a table with 10 samples of the corresponding log messages are sent to the endpoint you selected. You can view the table in full view using the link at the bottom of the alert.
Note: Currently, the Table view format is only supported for email and Slack endpoints. More endpoints will be supported in the future.
Grouping Results
Up until now, Logz.io users could use a single “Group By” option when defining their alerts. The “Group By” option is a convenient way of grouping together values for fields in logical groups, making alerts more concise and readable, and we’re happy to inform our users that the new version of Logz.io alerts now allows three grouping levels instead of one.
Going back to our example, it would make more sense if we could get our table to group together our server errors by client IP and response.
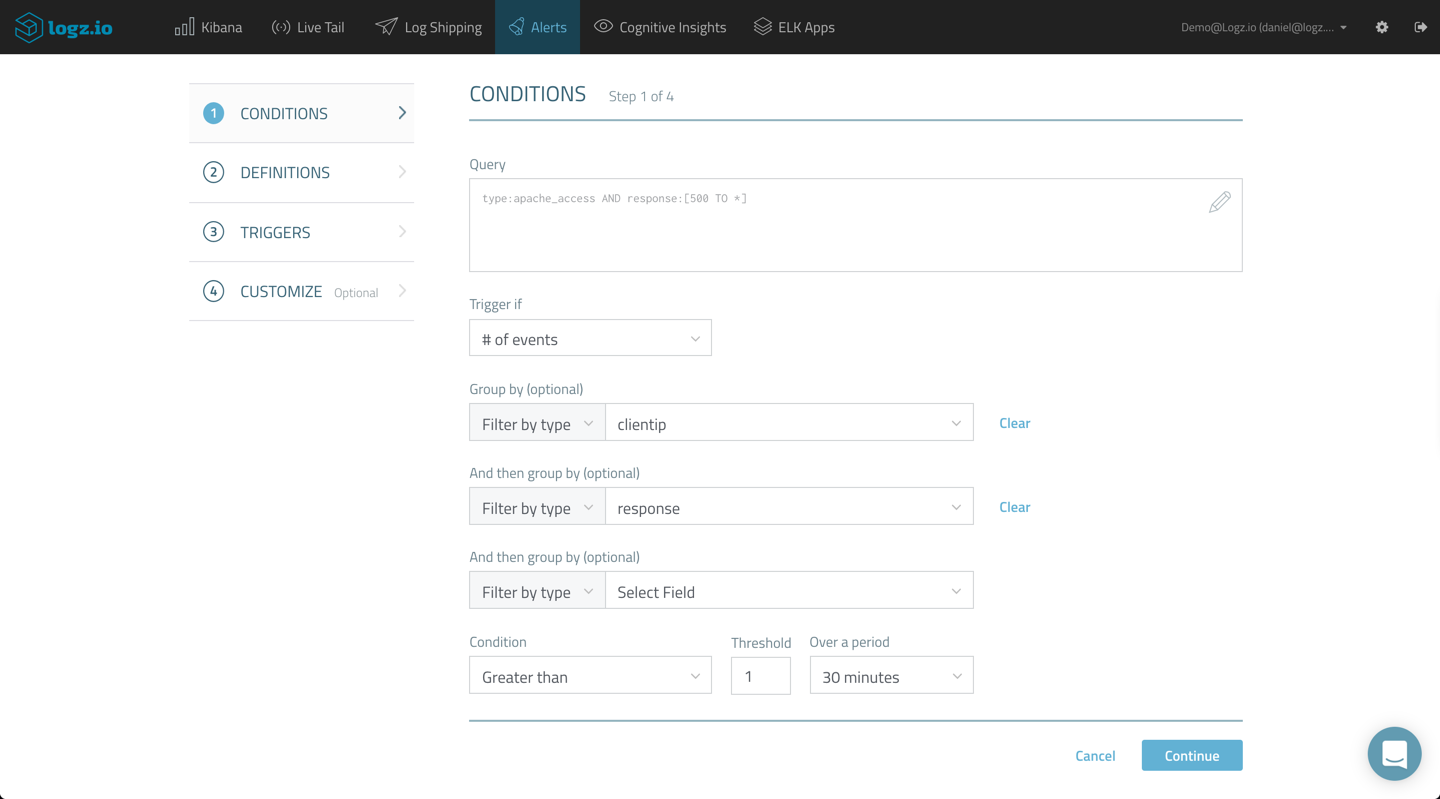
In the conditions step, I will use two levels of grouping to group results using the clientip and response fields.
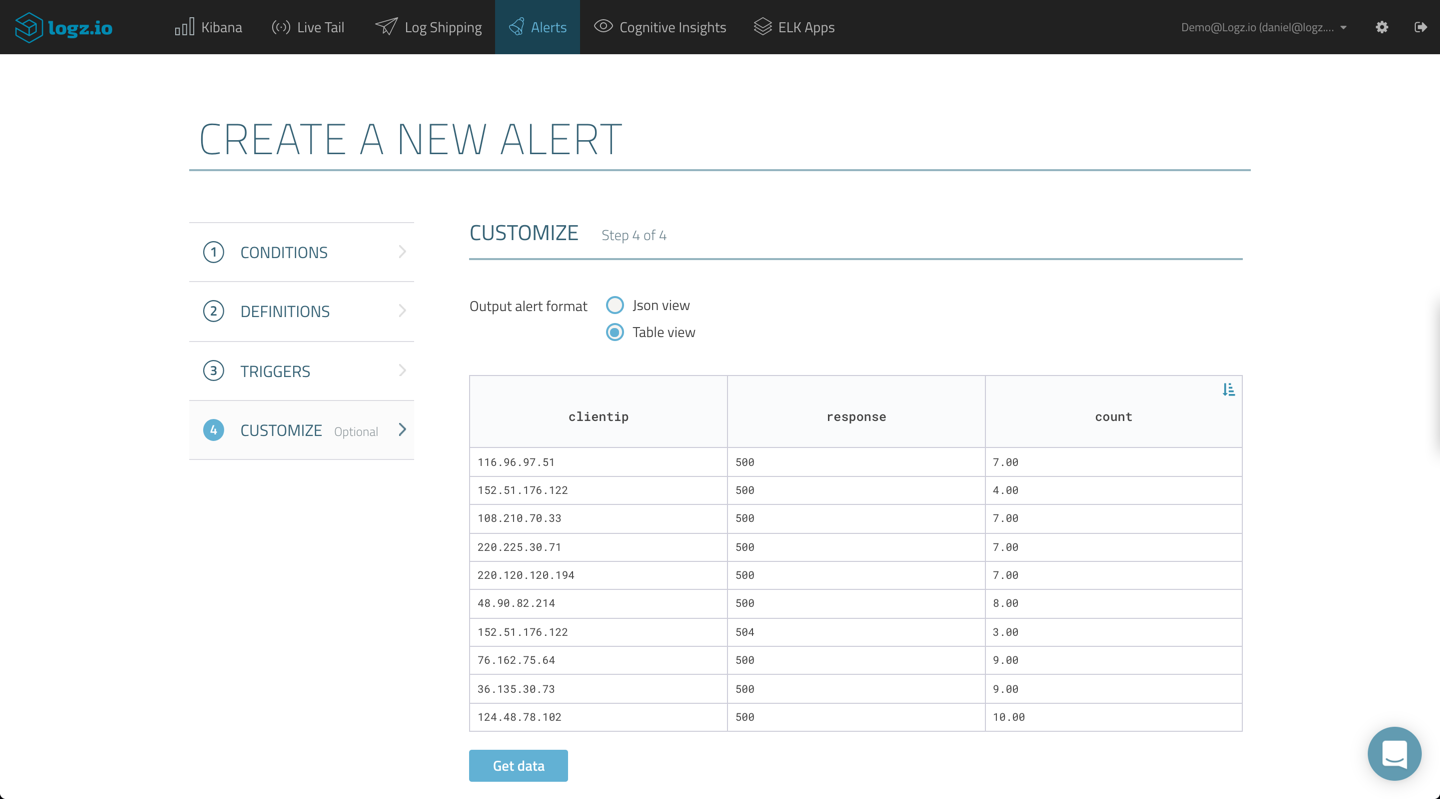
Skipping to the Customize step, the table is already configured with the fields used for grouping, and clicking Get Data gives you a preview of what your table will look like in the resulting alert. We can now clearly see server errors grouped together per IP and response code.
The REGEX filtering and sorting options are available, but because we are using these specific fields for grouping, the columns may not be removed and additional fields cannot be added. The resulting alert looks as follows:
Alerting is a critical element of log analysis and monitoring, but is still lacking in the ELK Stack. As part of its service, Logz.io provides an extensive alerting mechanism that allows users to create accurate, concise and actionable alerts which are delivered to any messaging or notification application.
We are constantly learning from our users about new ways they are using Logz.io Alerts and our platform in general. If you have a tip, best practice or even an idea for a new feature, please share either in the comments below or on the Logz.io community forum.
