Aggregated Alerting for Logs with Logz.io and BigPanda
January 4, 2017

In previous posts, I wrote about the integration between Logz.io and Datadog and PagerDuty. In this article, I’d like to introduce you to an additional new integration — this time with BigPanda.
Just in case you’ve never heard of the platform, BigPanda aims to help users reduce the high signal-to-noise ratio in today’s IT monitoring stacks. A typical monitoring configuration consists of multiple tools, with each one generating its own set of alerts. BigPanda promises to help teams to correlate these different alerts and identify the ones that really matter.
Logz.io’s alerting feature allows you to create advanced alerts on specific log messages, with recent updates allowing users to create alerts using Elasticsearch metric aggregations such as max, min, avg, and sum.
Let’s see how these two platforms play together.
Creating a New Integration in BigPanda
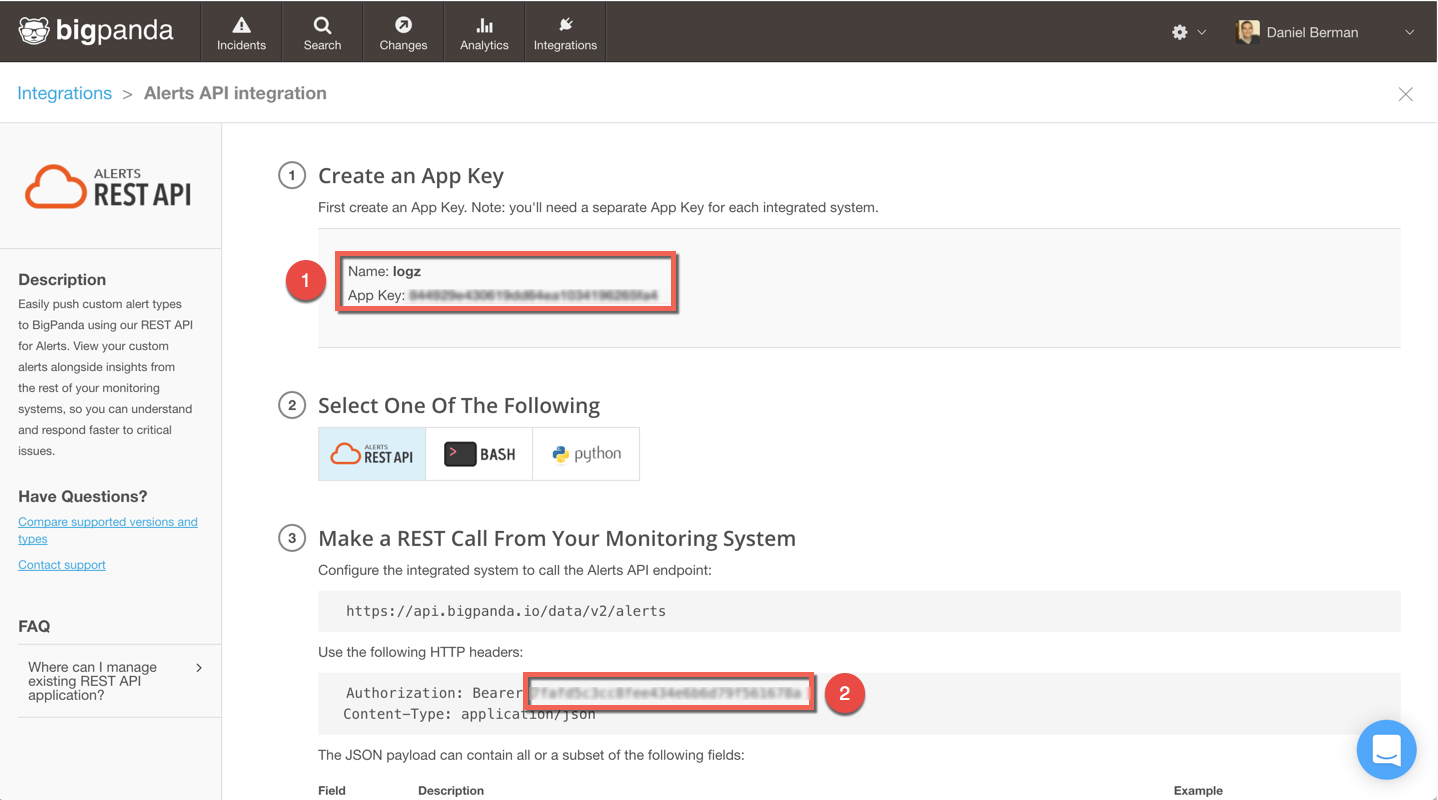
First, we need to set up a new integration within BigPanda to retrieve a token and API key.
More on the subject:
This is easily done via the Integrations tab in BigPanda. When asked to select what type of integration, select REST API. On the Integration page, you will then be required to generate an app key. In this example, I have named mine “logz.”
You then have the two pieces needed to create the integration in Logz.io: (1) The app key and (2) a token:
Creating a New Logz.io Endpoint
Now that we have the required pieces to set up the integration, we’re going to set up a new alert endpoint in Logz.io.
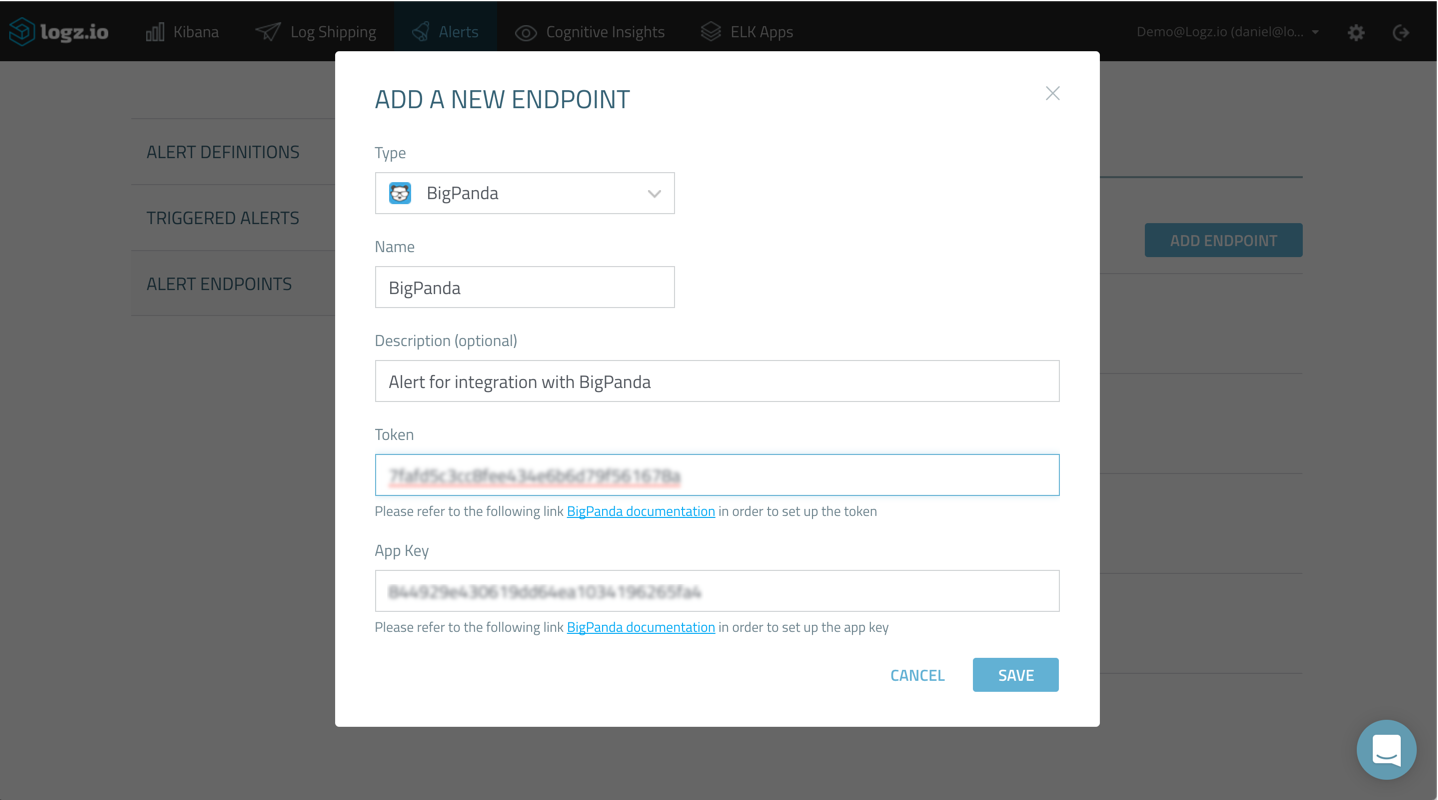
Under the Alerts tab, select the Alert Endpoints page and then click “Add Endpoint”:
Select “BigPanda” from the “Type” drop-down menu, and fill in the required details using the app key and token that we retrieved above.
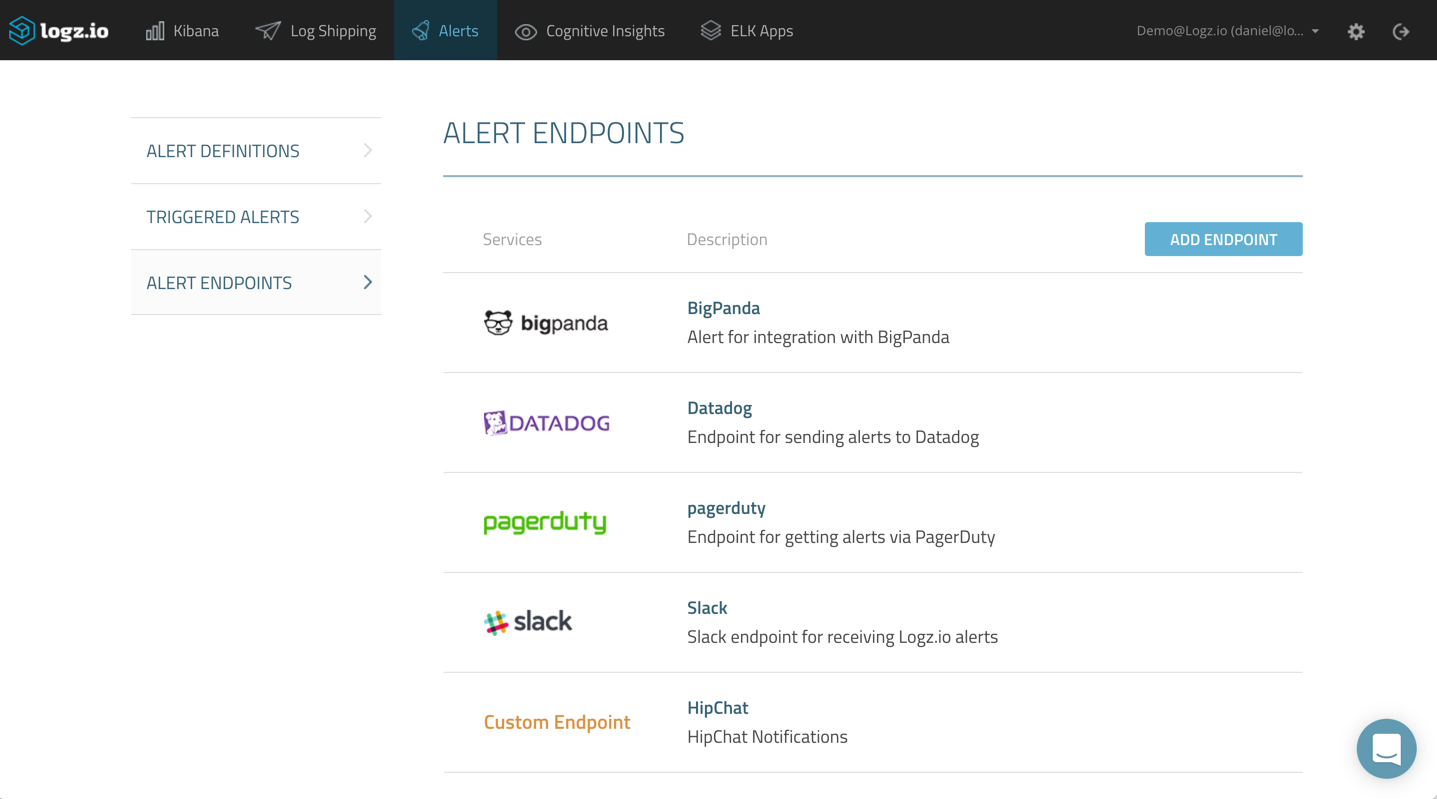
After you save the new endpoint, it will be added to the list of endpoints defined in Logz.io:
Creating a New Alert
Congratulations! The integration is set up, and all that is left now is to configure a new log-based alert to test whether the integration is working as expected.
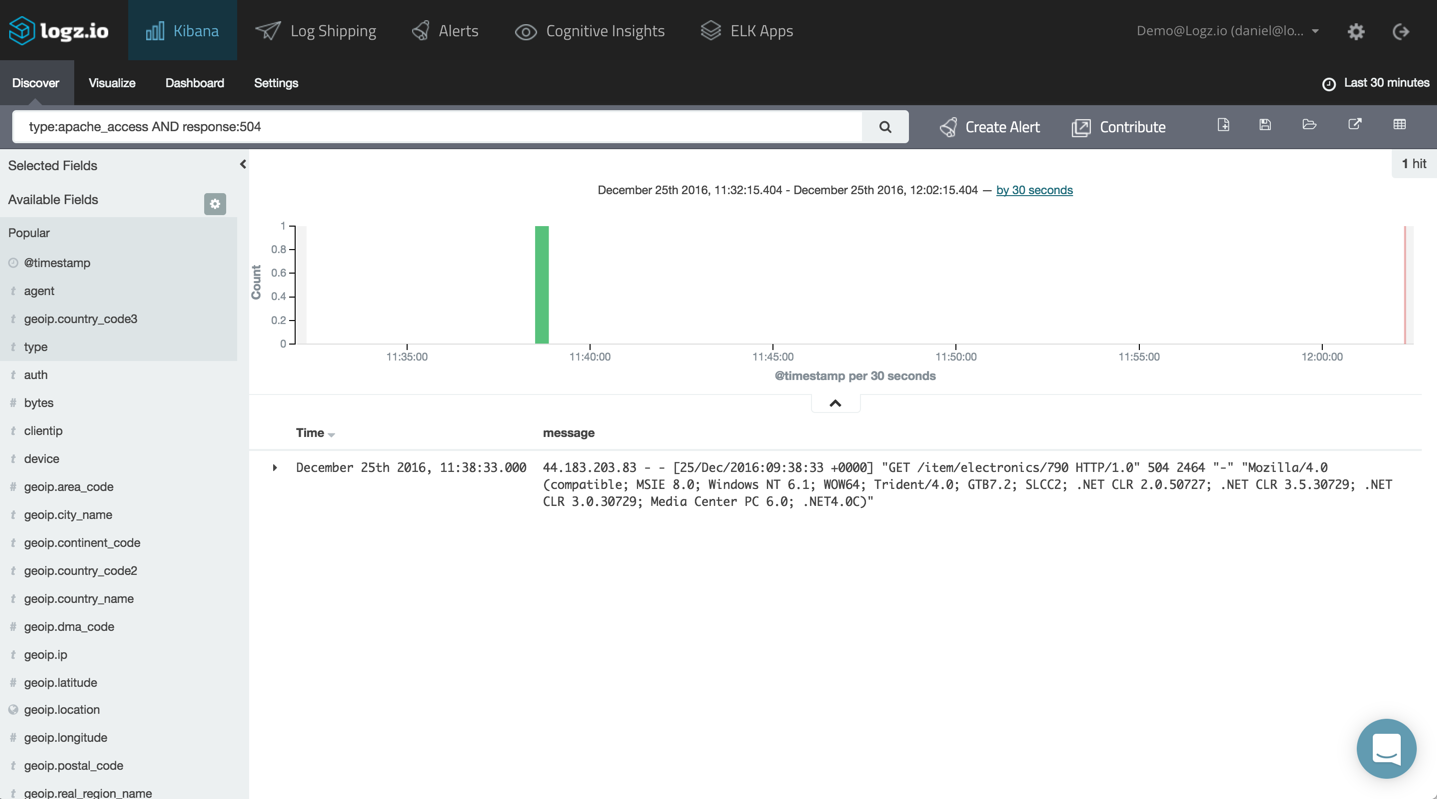
Creating a new alert in Logz.io is done from the “Discover” tab in Kibana. Enter your query in the “Search” field — in this case, I’m looking at an Apache access log that reports a 504 error:
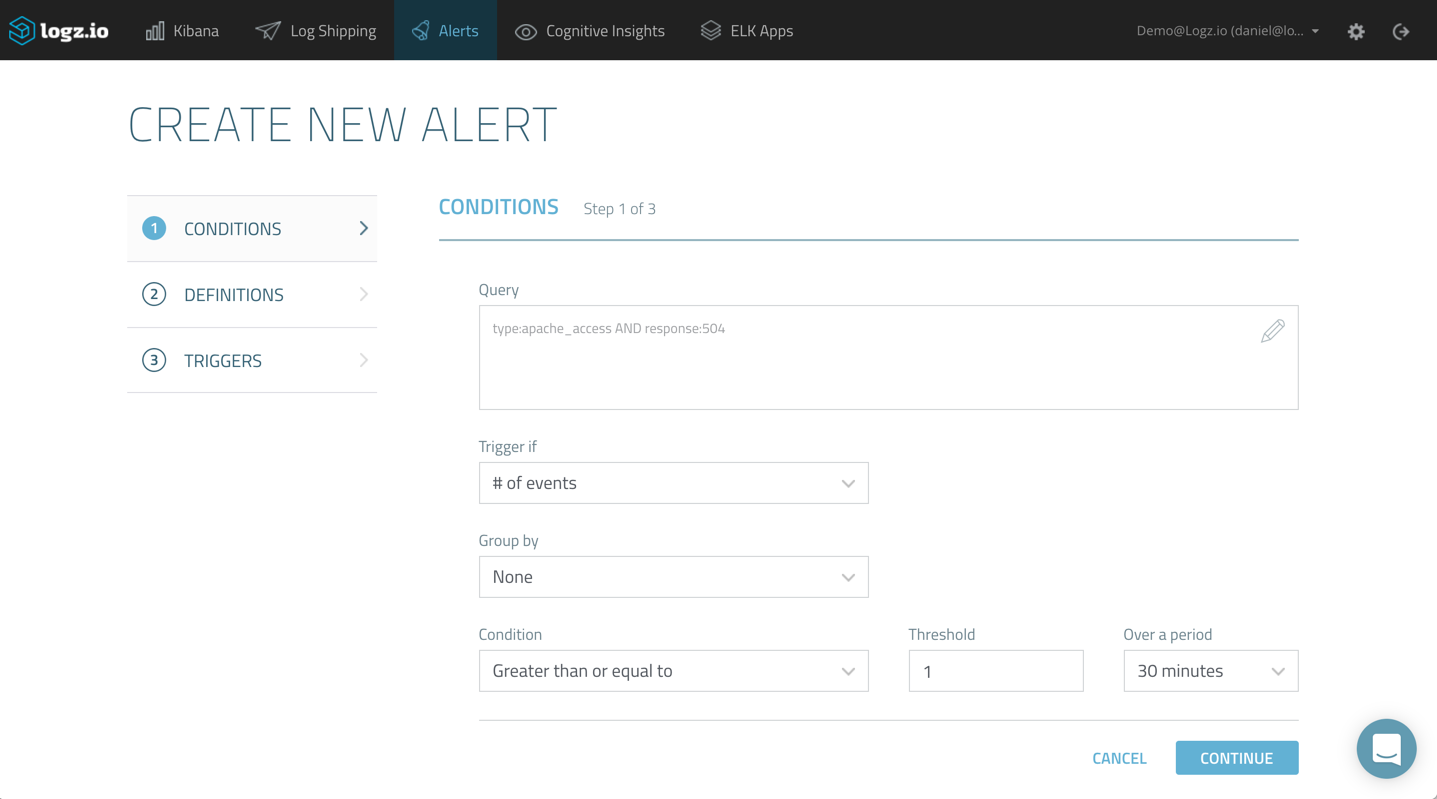
Once you’ve narrowed down the type of log message on which you want to be alerted, click the “Create Alert” button. The query is copied to the Alert Creation Wizard, where it can be modified as desired:
On the first page of the wizard, you will need to configure the trigger conditions — or, in other words, select which specific conditions will trigger an alert.
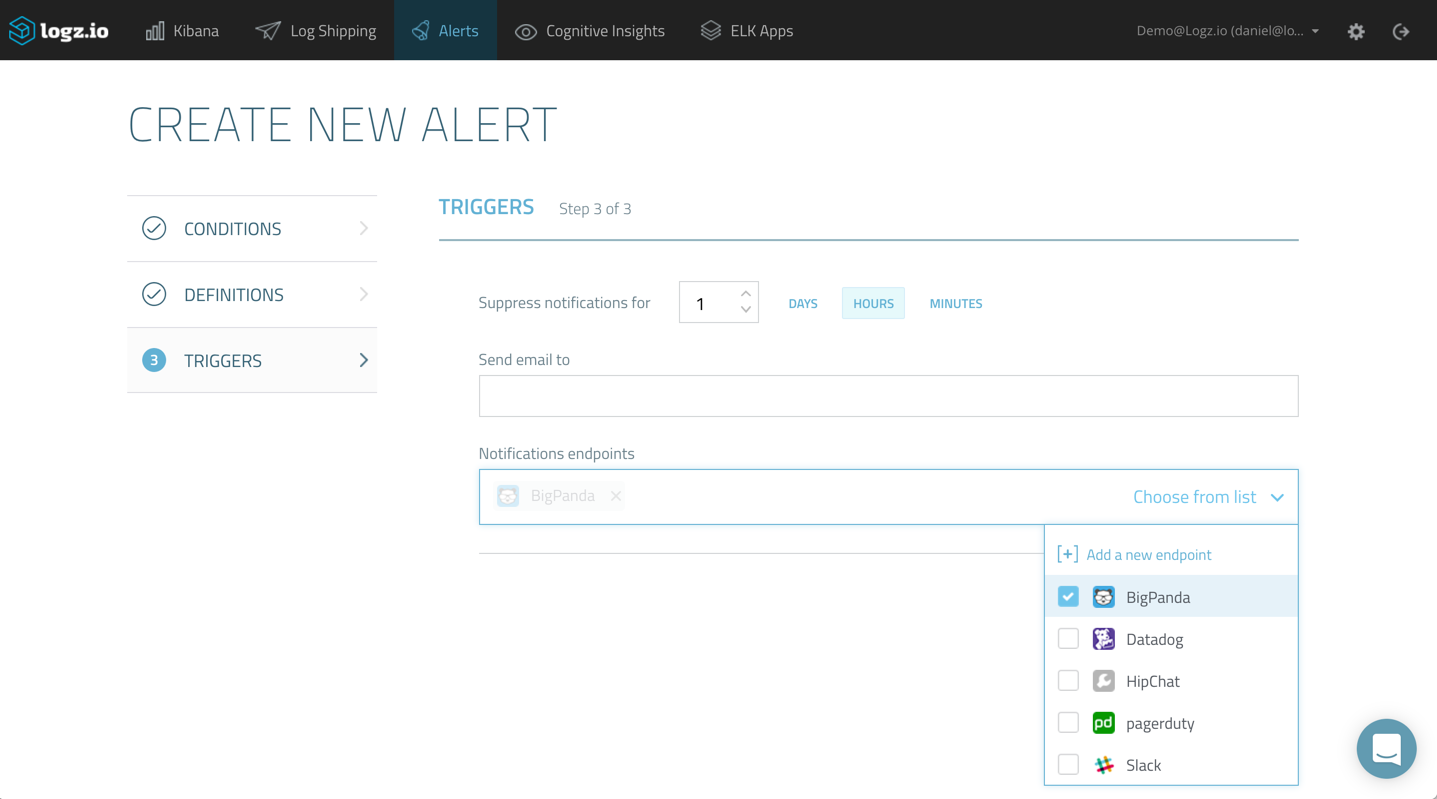
Then, after naming and describing the alert on the following page, all that’s left to do is select the BigPanda endpoint on the third and final page of the wizard:
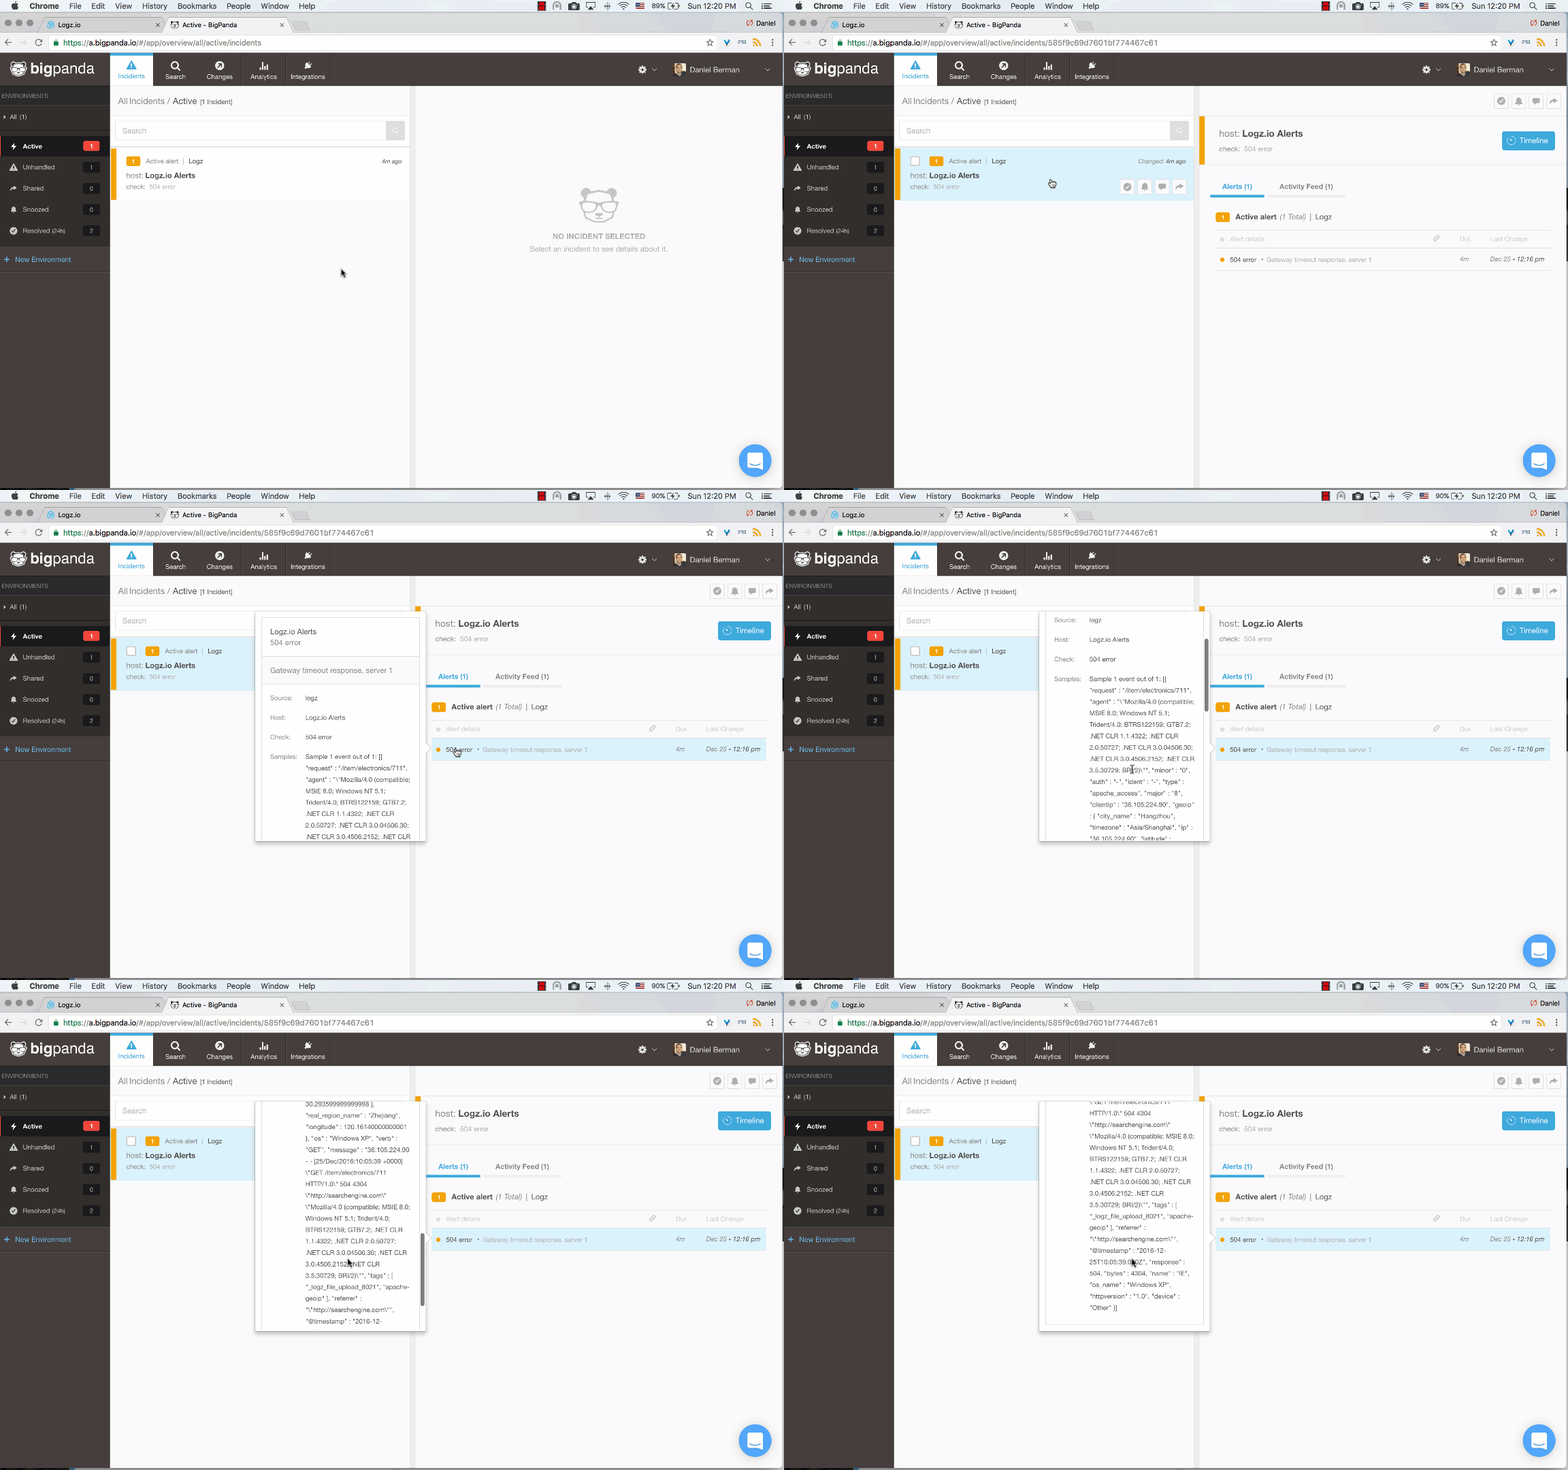
Create the alert and open the Incidents page in the BigPanda UI. Once an alert is triggered in Logz.io, it will show up as a new incident in BigPanda.
Open the incident and select it to see more details on the log message:
Note: To reduce the amount of “log noise,” Logz.io will send a maximum of five samples of the same event.
Once in BigPanda, you can use the rich sharing and event management features to manage and correlate with alerts from other integrations.
Additional Resources
