
5 Docker Monitoring Solutions on Show at DockerCon 2016
June 21, 2016
SEATTLE, Washington — Docker is being used in more and more production deployments. As such, the ecosystem surrounding Docker is picking up the gauntlet by creating more and more solutions for monitoring — which is crucial for keeping tabs on a Dockerized environment and gaining visibility into the state and health of containers.
More on the subject:
With so many platforms available, it’s tough to tell the difference. Nothing exemplifies this than DockerCon. While walking through the Expo Hall yesterday, I counted at least ten companies professing to do Docker monitoring on some level or another. I decided to see how five of these companies differentiated themselves from their competitors by interviewing their representatives.
Here is what I found.
Dynatrace
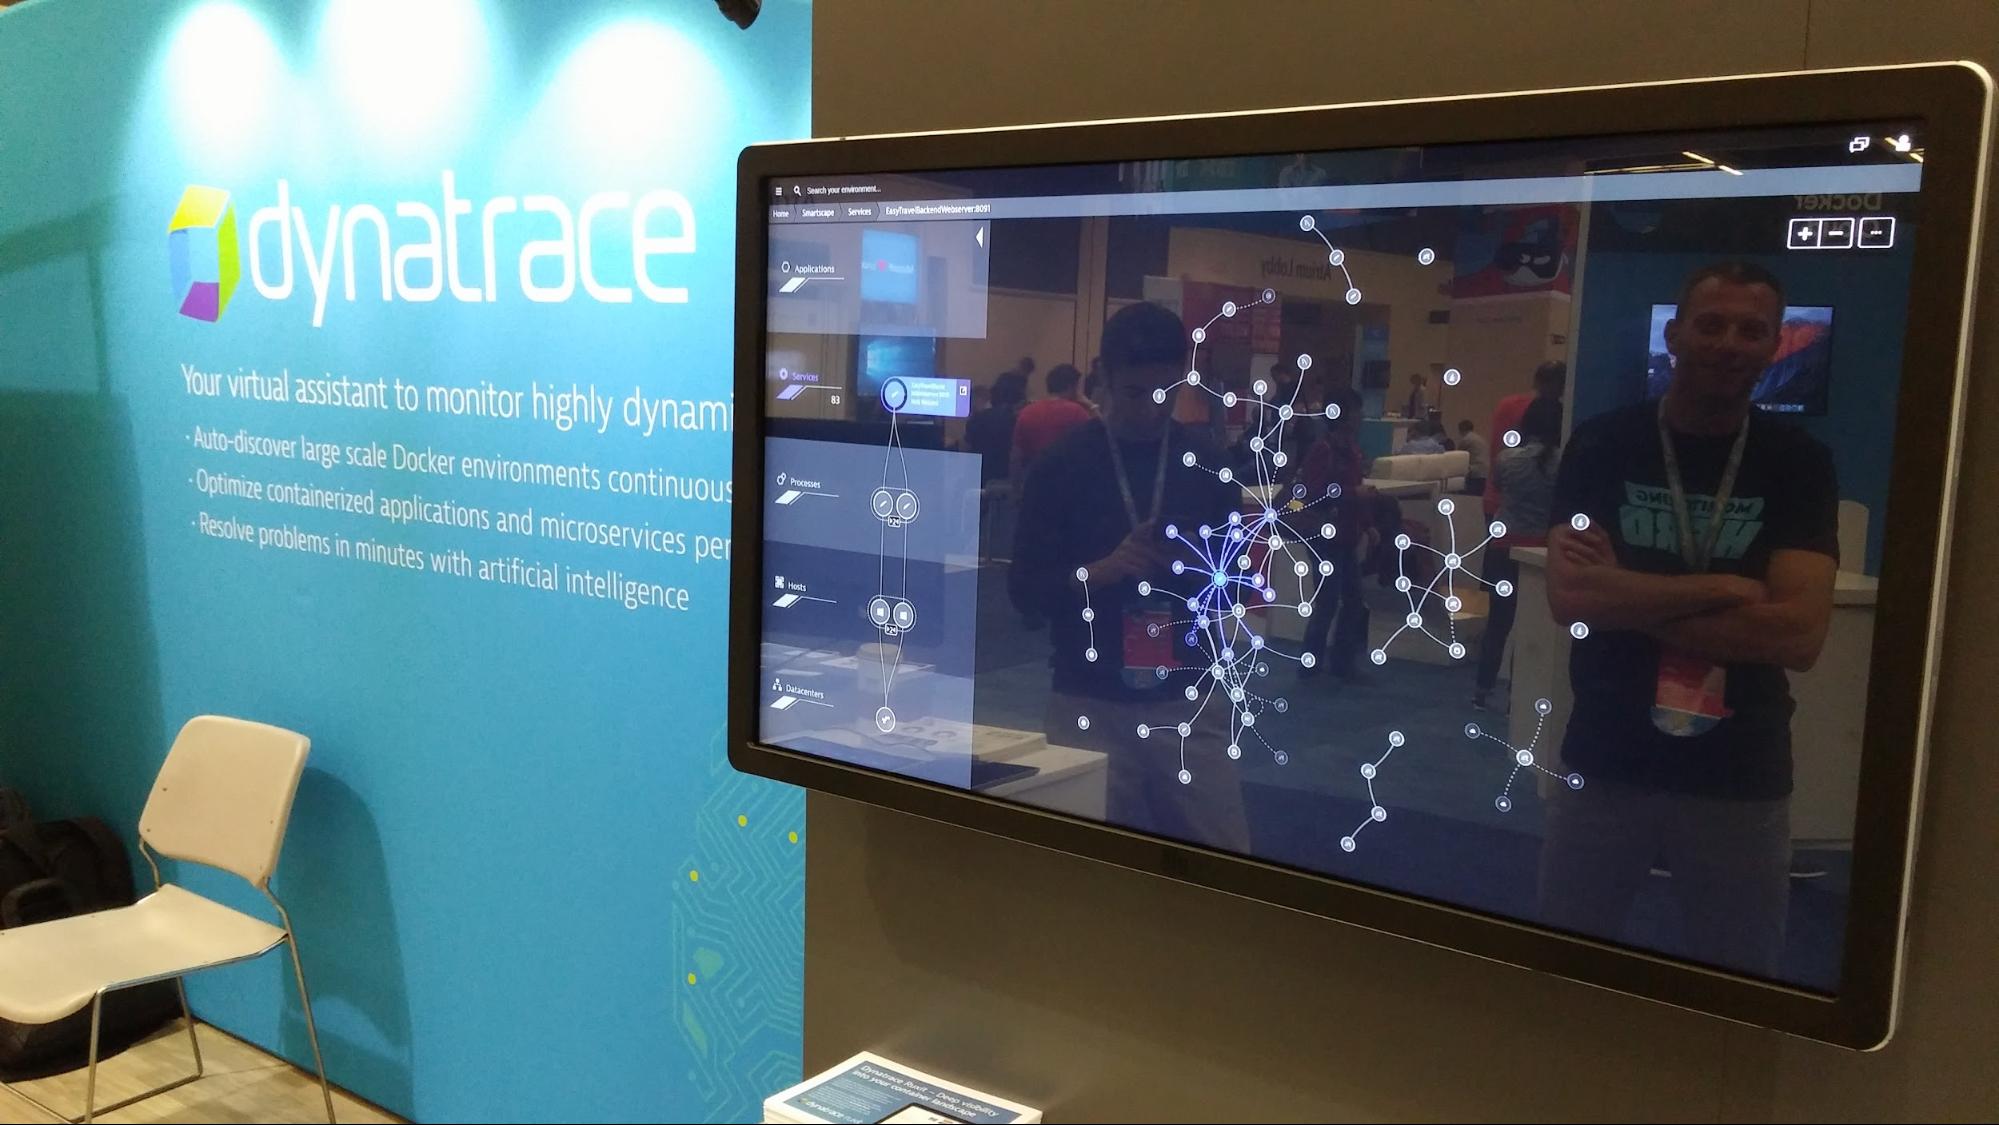
Dynatrace offers a powerful solution for Docker monitoring by providing users with high-level metrics that are crucial from a business perspective together with extremely detailed insights on containerized services.
Docker users will see the information that is specific to images and containers such as the numbers of images being used, running containers, and per-microservice metrics. Dynatrace’s Smartscape feature shows a map of what component in your stack relies on what — helping you to understand the relationships between all the different layers (including your Docker containers themselves).
I spoke with Pawel Brzoska, a member of Dynatrace’s product management team, who pointed out that as opposed to other Docker monitoring tools, his company focuses on metrics that are generated on the client-side as well: “Our focus is on measuring user-experience as well, so we explore whether the actual users of the application are happy by measuring metrics on the client-side such as page load.
Datadog
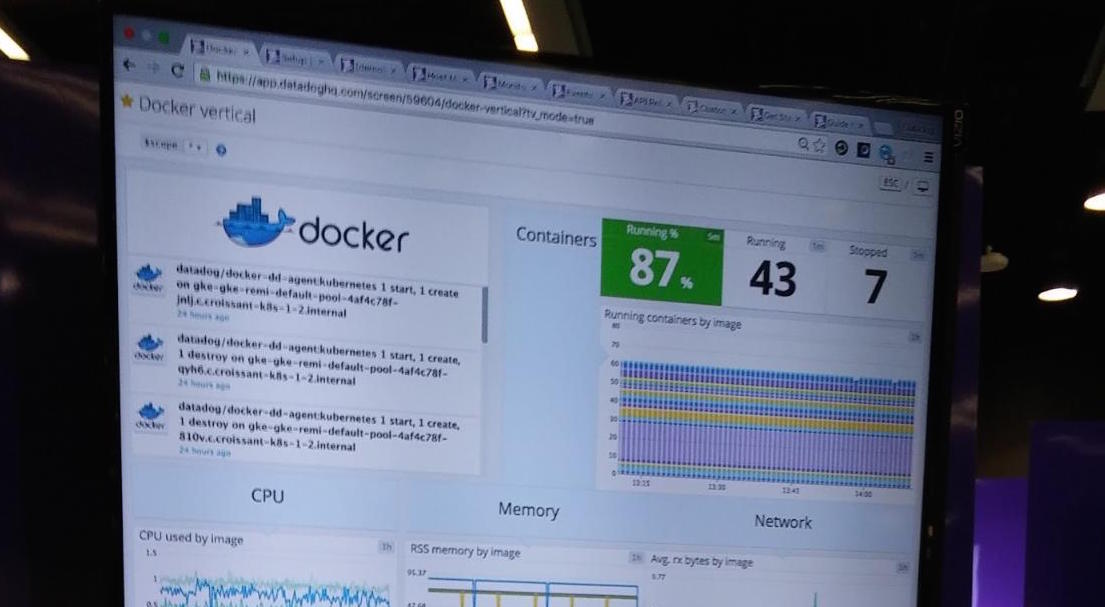
Datadog is a cloud-based solution that monitors the infrastructure behind your applications, tracking metrics and events that shipped via agents, APIs, or even third-party tools (including some of the other monitoring tools listed here) from databases, configuration management tools, cloud services, and, yes, Docker. Good guess.
For Docker environments, Datadog supplies an agent that can be either installed or run as a container on your host. The agent connects via the Docker socket and aggregates docker-stats data, which can be analyzed using a dedicated dashboard and sliced and diced per container.
At DockerCon, a new feature called “Service Discovery” was announced that enables Datadog to identify the type of containers running on the host and the ports being assigned to it automatically.
Datadog’s strengths are both the ability to combine data from various inputs and the integrations it has with Docker orchestration and management tools such as Kubernetes, Mesos, and Swarm. Ilan Rabinovitch, Director of Technical Community at Datadog, agrees: “Strong integrations with Kubernetes and Swarm are tighter than others in this specific space. Due to the dynamic nature of the cloud and the realm of microservices, what is important is the ability to combine data sources and data types.”
SignalFx
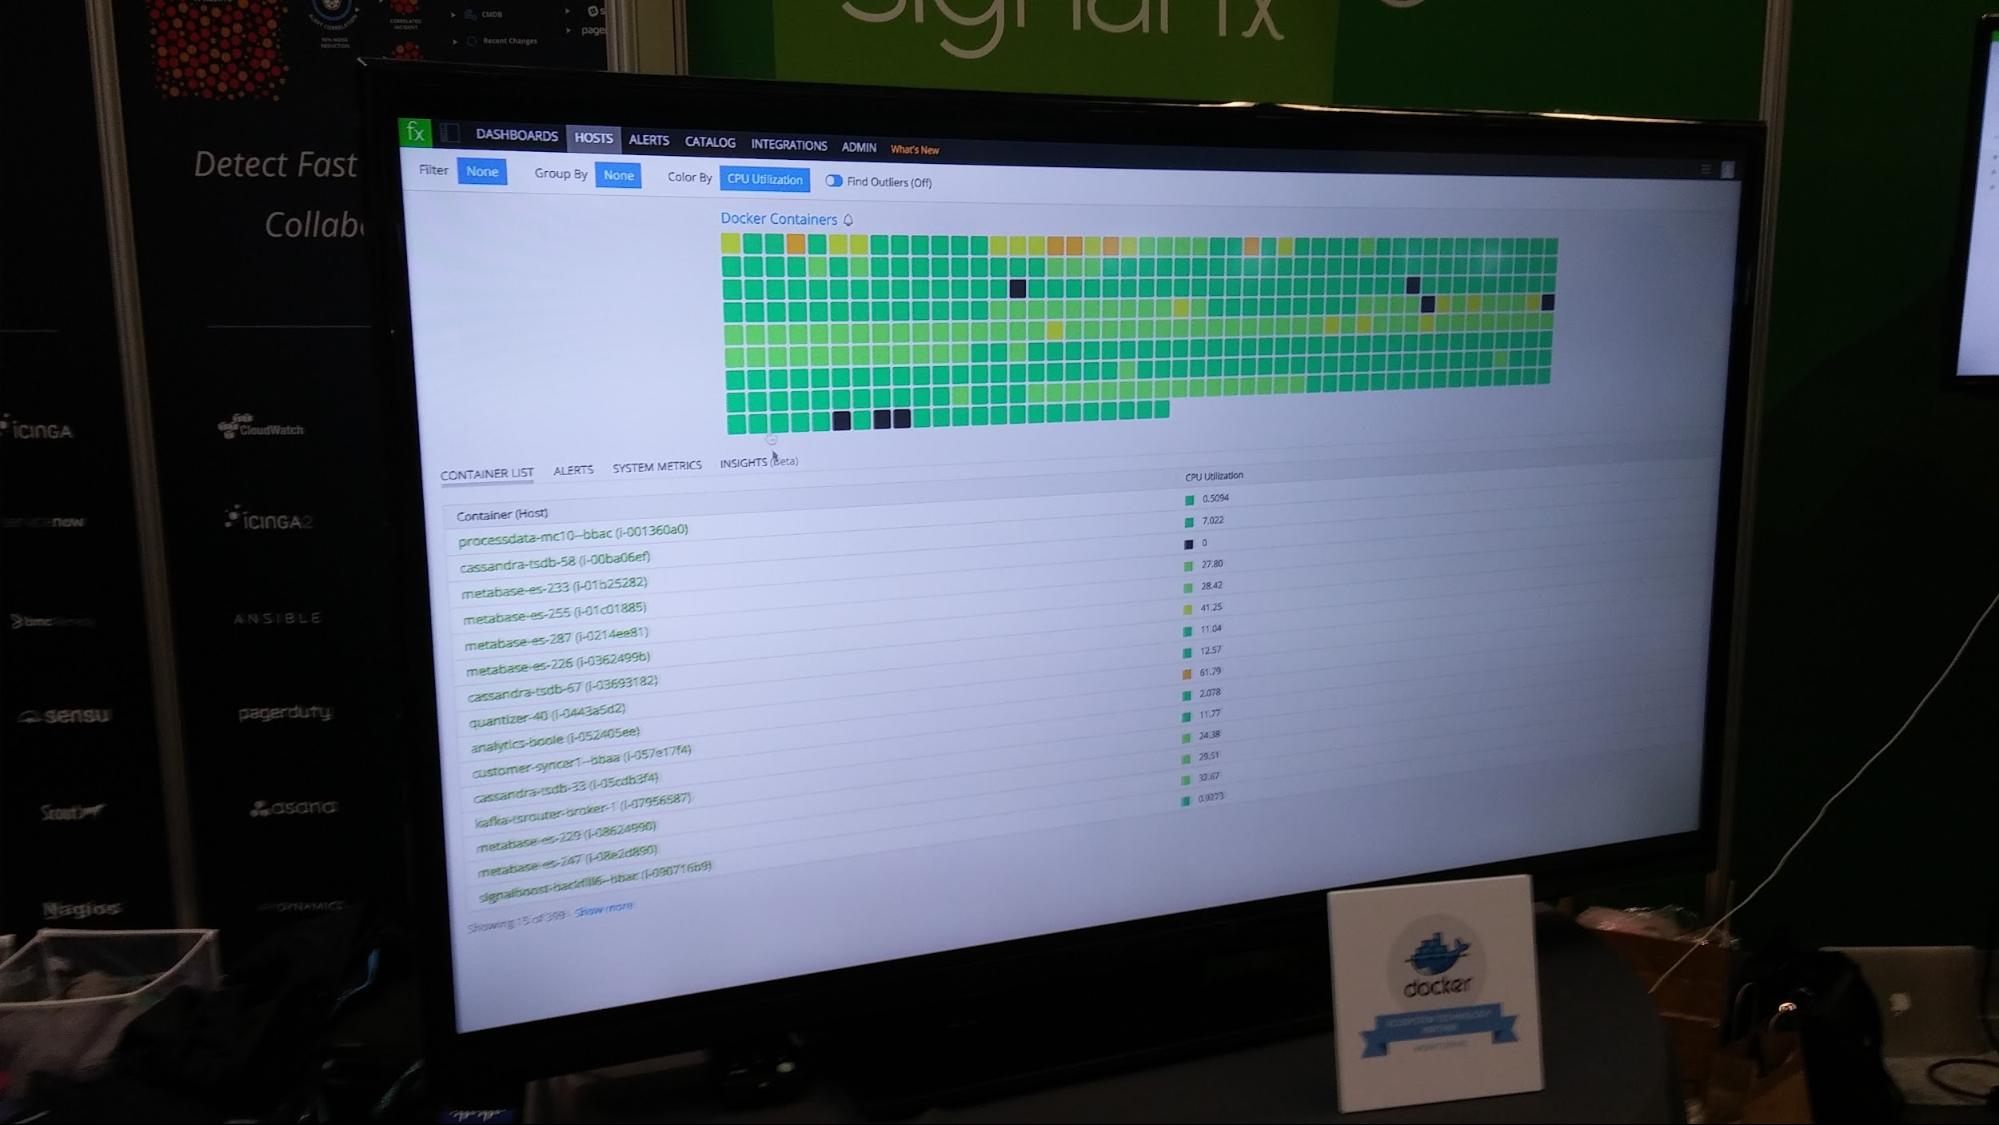
SignalFx has a very interesting story to tell, based on the number of open source technologies that have been deployed on Docker in production since 2013. I chatted with software engineer Maxime Petazzoni, who was very clear on the value he sees SignalFx bringing to the table.
SignalFx allows users to perform advanced diagnostics using built-in computations and functions for real-time analysis and with extremely low latency. Real-time was indeed real-time — seeing the needles in their monitoring dashboards move every second was impressive.
SignalFx provides a number of dashboards for Docker including a per-host dashboard and a general dashboard showing data on all of the containers across hosts, making it relatively simple to drill down and troubleshoot a problematic container.
So, the value here is clear. As Maxime puts it: “As a software engineer, I see the benefit when a system can perform this kind of computation for monitoring modern applications across different time series with extremely low latency and in real-time.”
Sysdig
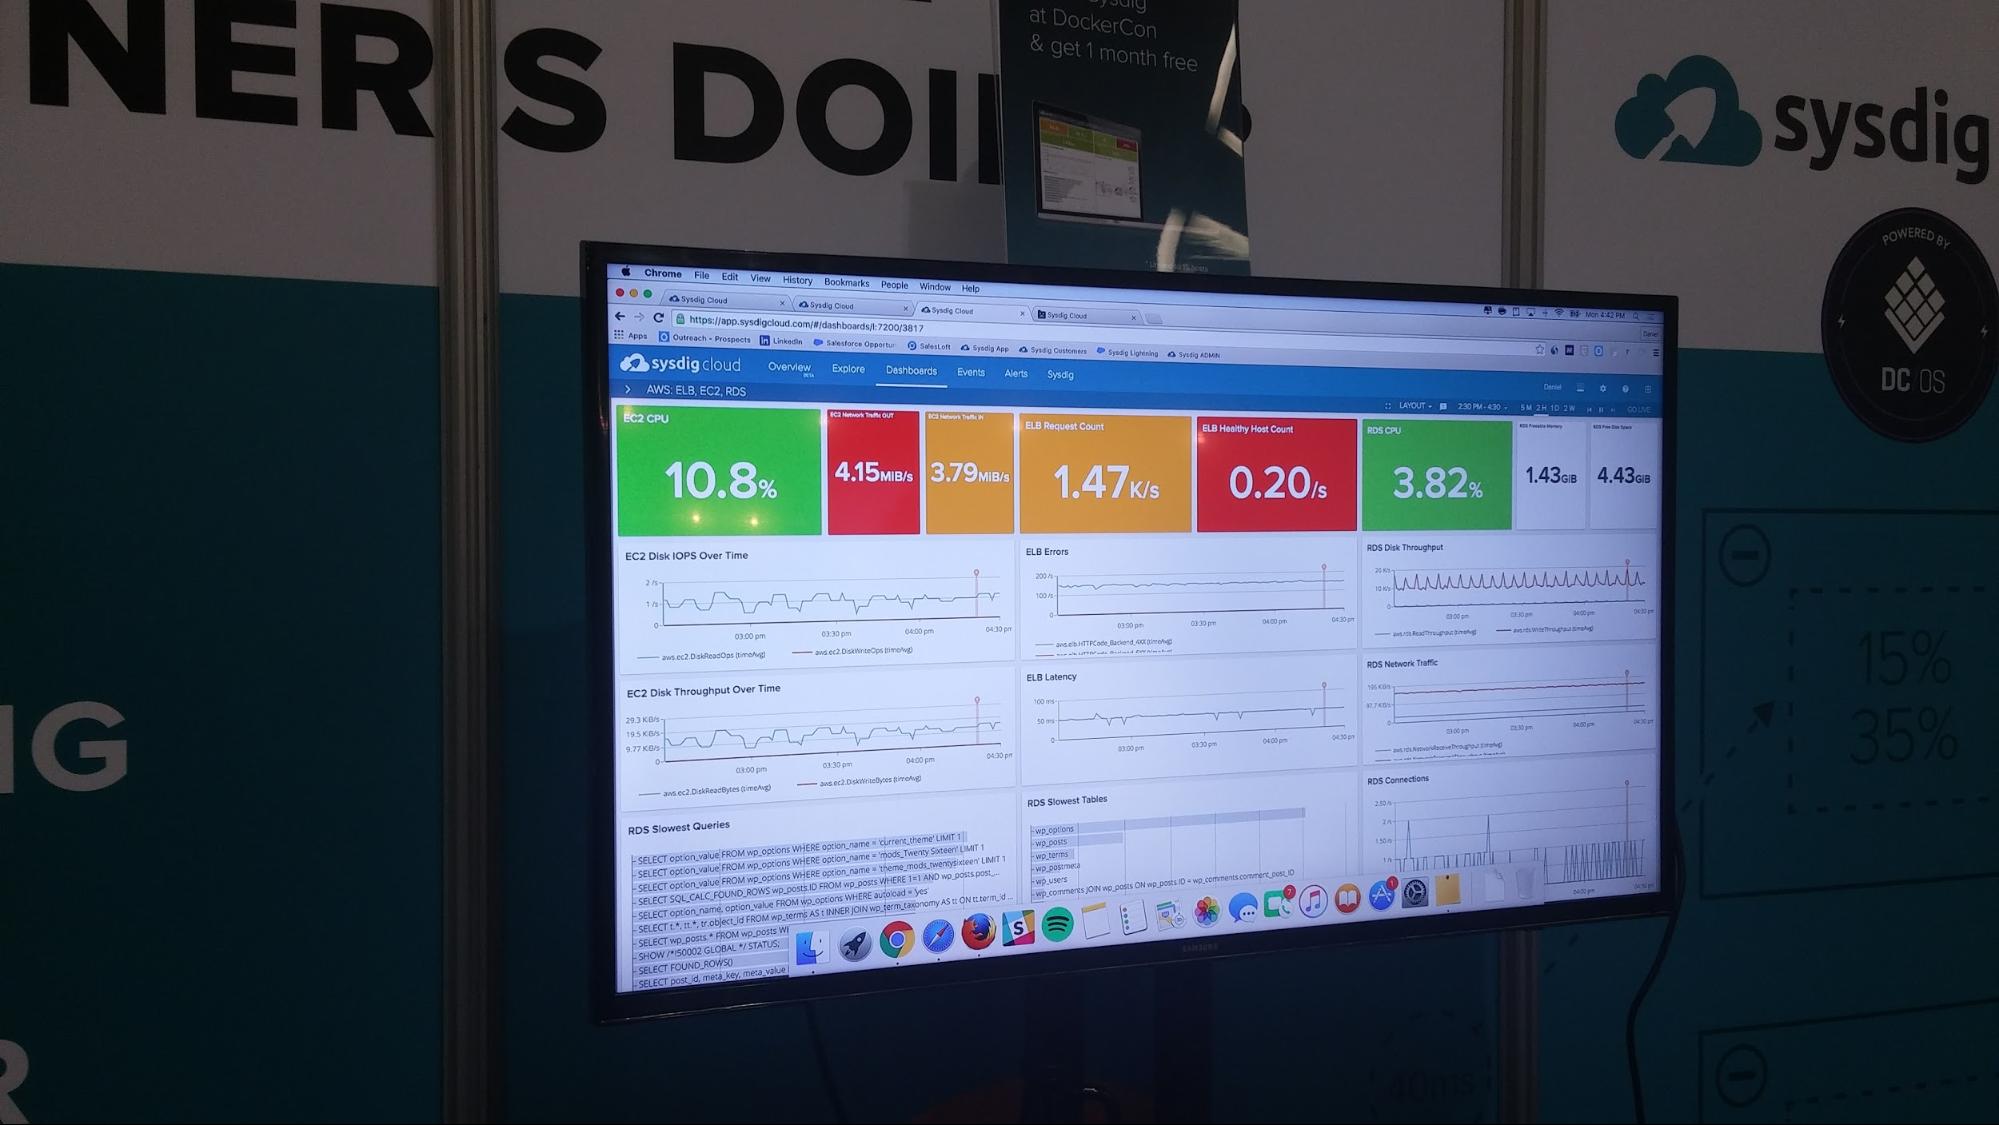
Sysdig is a different kind of beast.
Started as an open source project that focuses on monitoring microservices, Sysdig “sees inside your containers without instrumenting them,” says Daniel Liong, a member of the Sysdig product team.
What this means is that instead of installing an agent on your Docker host, the Sysdig agent sits at the operating system level — so instead of looking from the inside, Sysdig looks at the containers from “the outside.”
The agent looks into the actual system calls made to the kernel (system, network, disk I/O), allowing you to understand the processes that are running in the system and the services running in a container.
The results of this “container-native monitoring” are presented in a monitoring dashboard that displays a wide array of visualizations representing container-specific performance and monitoring metrics.
New Relic
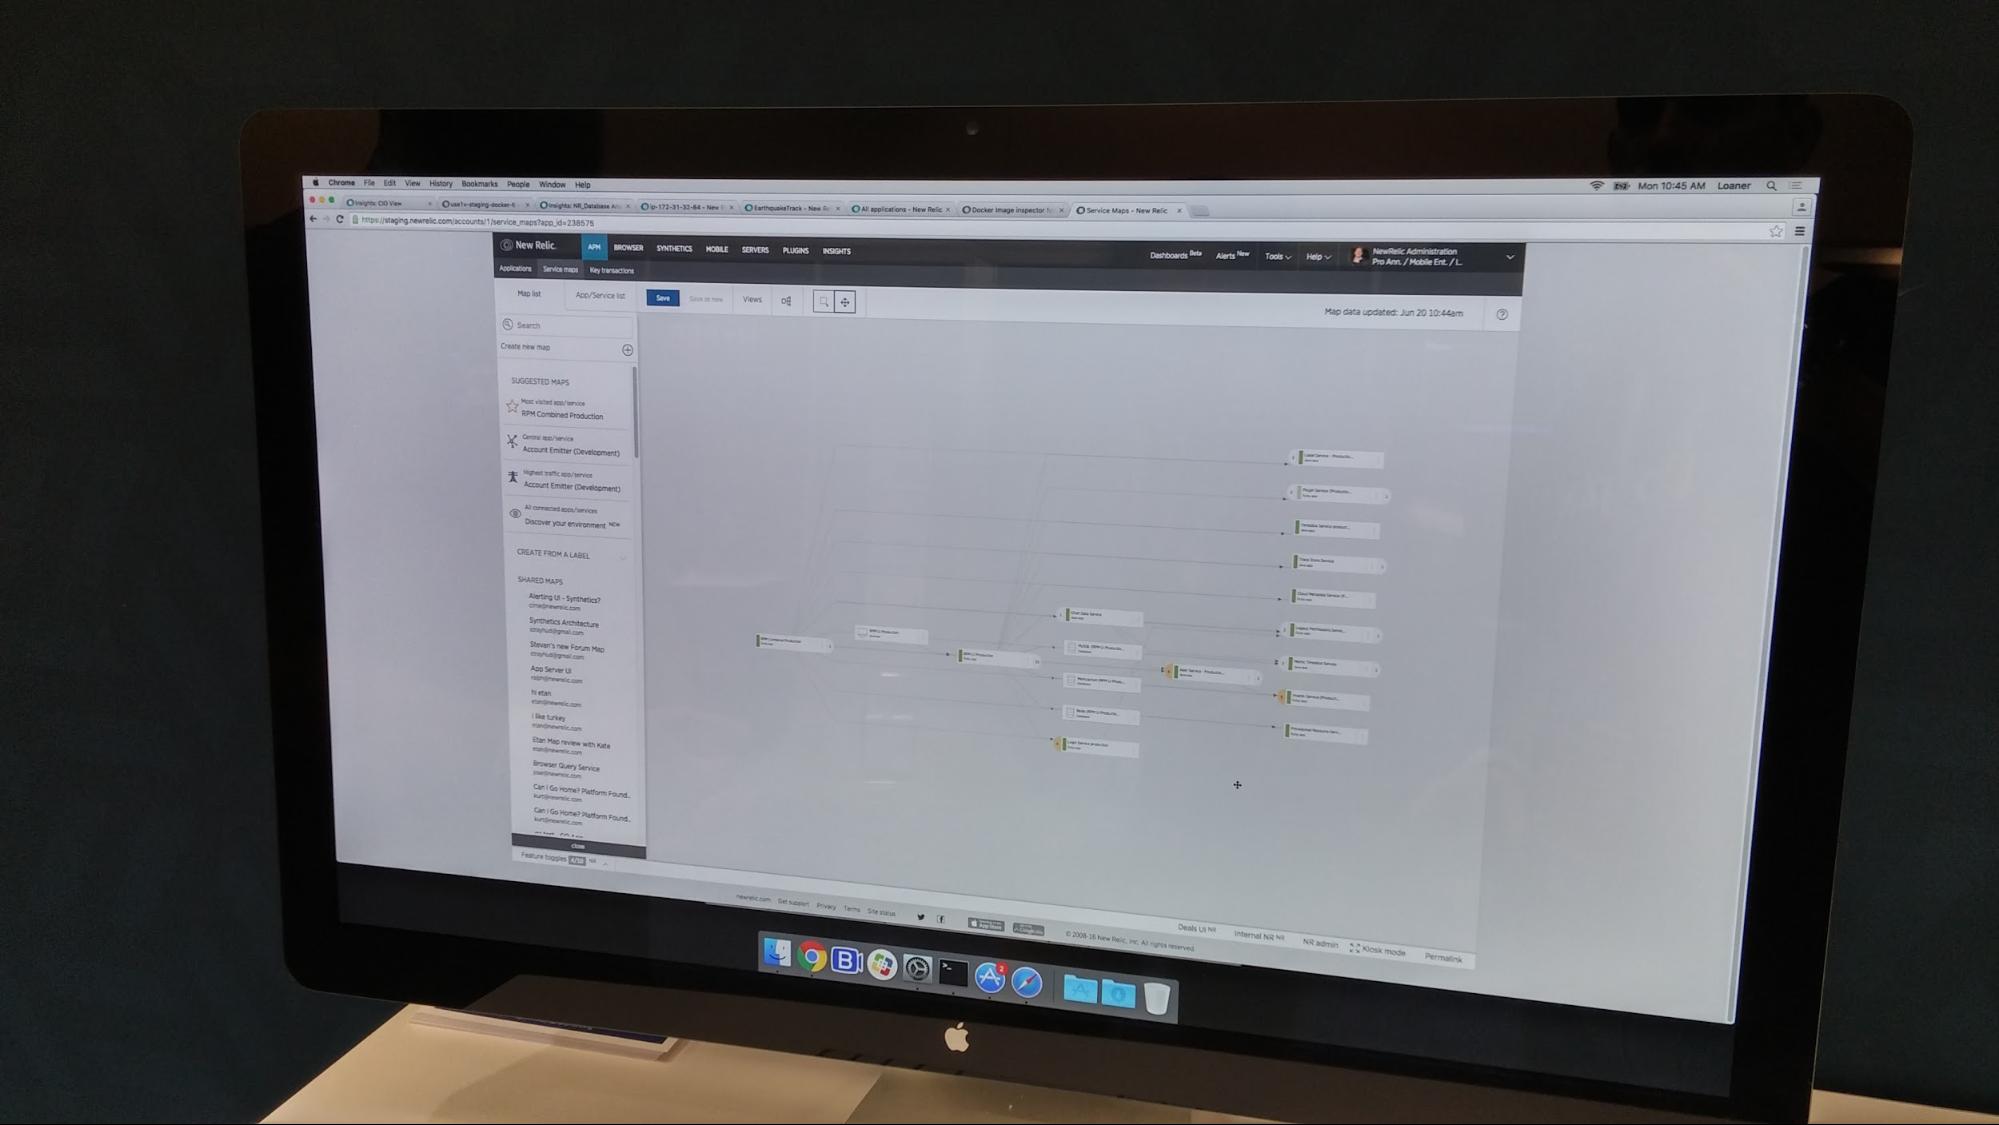
New Relic is more application- and server-centric, enabling users to drill down per server from the application level to containers.
Users can see key metrics on each container by sorting them by CPU or memory. This data can then be integrated with New Relic’s Insights feature to query and visualize the collected data on your Docker environment in real-time.
Mike Panchenko, the founder of Opsmatic (which was acquired by New Relic), sees plenty of competition in the world of Docker monitoring and told me that the main difference between New Relic and others is the context that it provides: “The best tool that lets you slice and dice infrastructure the best way will win. The tool needs to be flexible enough to be suited to the user’s environment.”
Last, But Not Least…
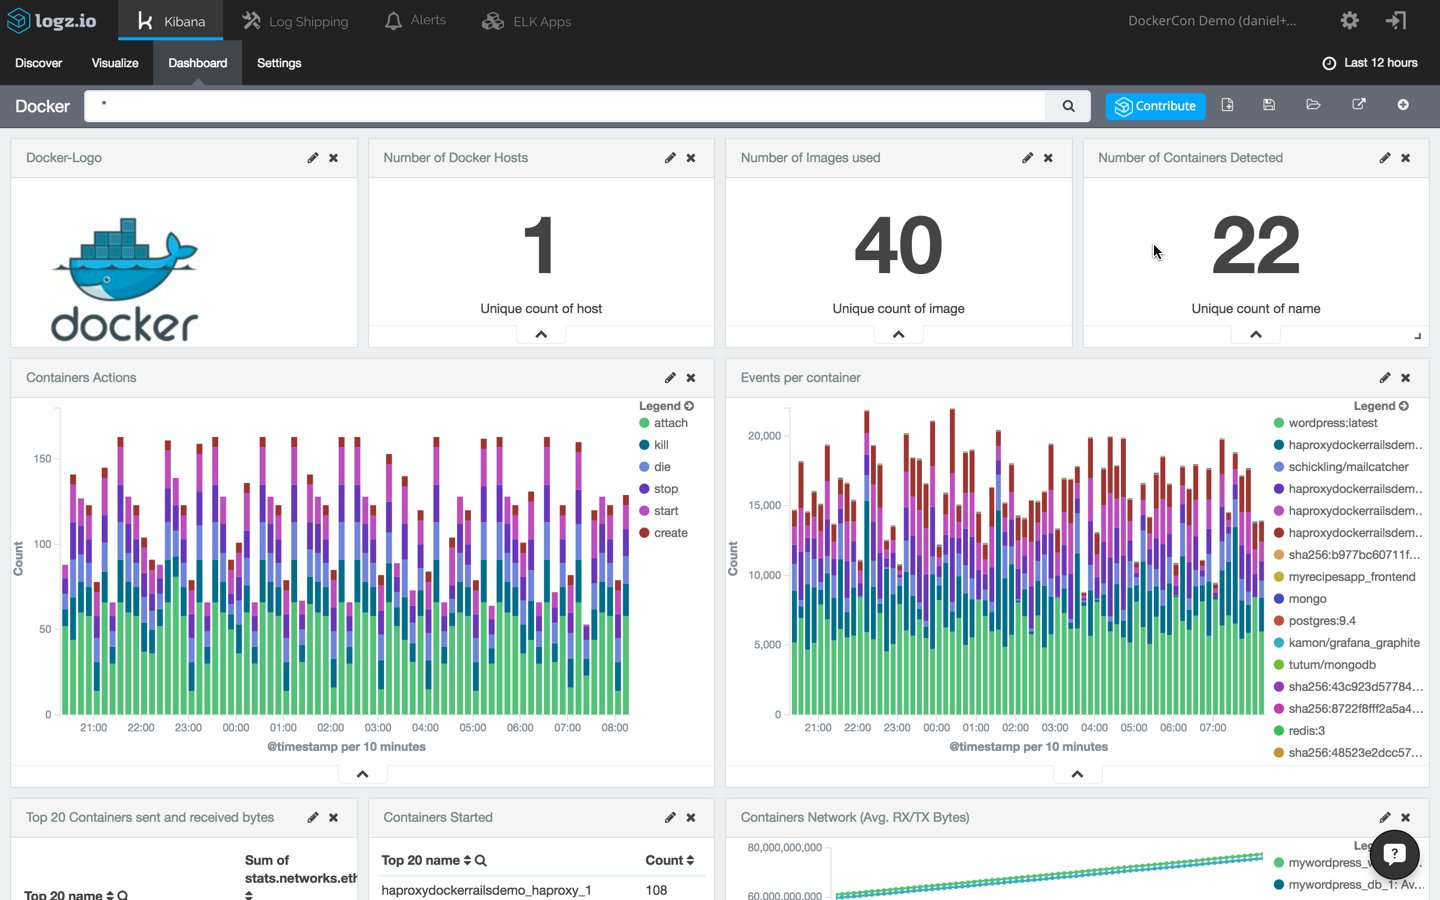
I would be remiss if I didn’t mention our own Docker Log Collector, which offers a different type of solution. This method latches on to the Docker API and ships Docker logs, statistics, and dameon events to the Logz.io ELK Stack. This data can then be analyzed and visualized using Elasticsearch’s powerful querying capabilities and Kibana’s visualization layer. Learn more about our Docker log collector in this blog post.
What monitoring solutions impressed you at Dockercon 2016? Tell us your favorites in the comments below!

You Might Also Like
Getting Started with Logz.io Cloud SIEM

