Distributed
Tracing
See an overview of app performance, and drill into details fast.
Quickly surface and debug issues in
microservices architectures
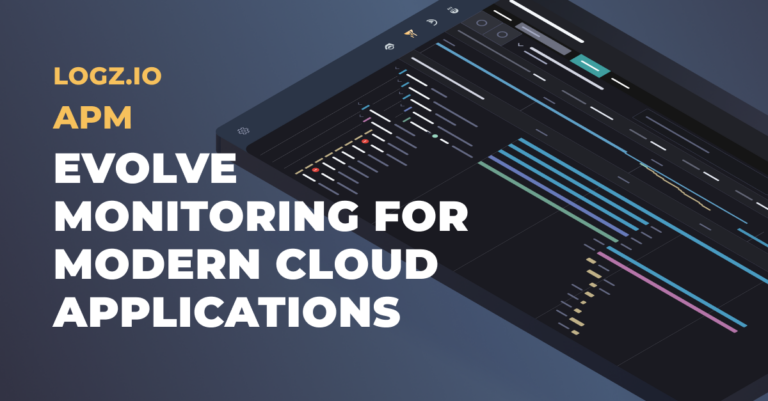
Start with an overview of application performance across your services, and quickly drill into individual transactions to diagnose the root cause of issues. Easily visualize the source of latency across application requests within microservices architectures.
Quickly surface and debug issues in
microservices architectures
microservices architectures

Quickly isolate the root cause of latency within microservices
- Improve code performance with visibility into the latency of every execution within a request.
- Easily visualize service relationships and dependencies across microservices architectures to quickly debug issues.
- Correlate logs with metrics and traces to quickly identify and resolve issues, with additional context from Trace Quickview in Explore log management UI.
Quickly isolate the root cause of latency within microservices

Monitor performance across your services with hardly any configuration
- Service Overview automatically catalogs each service and highlights critical application performance metrics to provide an overview of system health.
- After surfacing a potential issue, drill into specific service operations to explore the root cause.
- Correlate service performance metrics with the logs and traces from the same service during the same time-frame to enable fast incident investigation.
Monitor performance across your services with hardly any configuration

Map your system architecture to visualize and investigate application requests
- Auto-discover and explore your service map to gain visibility into any application request.
- Trace the call sequence through your system from any service endpoint to visualize and pinpoint production issues within complex architectures.
- Visualize the dependency graph of intercommunicating services to gather context around your services.
Map your system architecture to visualize and investigate application requests

Auto-instrumentation for your applications with OpenTelemetry
Easily instrument your applications with minimal effort using OpenTelemetry, the leading open-source observability framework.
Logz.io seamlessly integrates with OpenTelemetry, allowing you to automatically instrument your applications, capturing critical traces and using the native Logz.io exporter to send them to our backend, all with just a few steps.
Auto-instrumentation for your applications with OpenTelemetry

Correlate new deployments with service performance
By turning on Deployments, Logz.io automatically records every deployment and maps them on your service performance monitoring dashboards – making immediately obvious how changes to production impact system health and performance.
Correlate new deployments with service performance

Stay notified with real-time alerting
Immediately identify high-priority production incidents on your favorite notification system.
- Alert on sudden slow-down in service execution
- Alert on endpoints with a high invocation rate
- Stay notified via Slack, PagerDuty, email, and other channels
Stay notified with real-time alerting
What our customers say

“Distributed Tracing allows our team to trace incoming request flow through our application. This gives us more information about the latency of the services along the request path so that we can understand the root cause of bottlenecks and failures and collect data for future debugging and analysis.”
David Barda
Backend Architect, Duda
Backend Architect, Duda
Distributed Tracing features
Service Overview
Drill into individual transactions from high level performance metrics.
Service Map
Visualize the flow of requests through your applications to gather context.
Kubernetes 360
Search spans within the context of Kubernetes infrastructure performance.
Easy Connect
Automatically discover and instrument your services with OpenTelemetry in minutes.
Alerts
Be proactive! Use a built-in powerful alerting engine to get notified on critical events via email, Slack, or PagerDuty.
Cost and time efficient
Avoid the steep costs of leading proprietary solutions and the overhead of managing open source components at scale.
Multi-region, Multi-cloud
Logz.io is available on different cloud providers and across regions. Just take your pick.
User control
Add as many users to your Logz.io account as you see fit. The number of allowed users depends on your plan.
SSO
Simplify accessing Logz.io by using your organization’s credentials (AD, OKTA, OneLogin).
24/7 Support
Who’s going to answer the phone in the middle of the night? Logz.io has you covered with 24/7 in-app chat support.
Sub Accounts
Segregate your Logz.io account into sub accounts, each with its own data allowance and account token.
Sampling Rules Wizard
Step through a wizard UI to define your trace sampling policy, to simplify configuration of OpenTelemetry Collector
Logz.io Distributed Tracing FAQs
What is the difference between distributed tracing and Application Performance Monitoring (APM)?
Distributed tracing is a core capability within Application Performance Monitoring (APM). APM provides a more holistic view of your application performance, while distributed tracing makes it easy to analyze the performance of individual requests.
What is the difference between Jaeger and Zipkin for distributed tracing?
Jaeger and Zipkin are two popular choices for distributed tracing. The overall architecture is similar for both, and they both are open source tracing tools. While Zipkin is an older, more mature tool, Jaeger is faster and more flexible. Jaeger is also more performant and much easier to scale. Learn more about the differences between Jaeger and Zipkin.
What is service performance monitoring and is it important?
Service performance monitoring is a way of assessing the health and performance of application services on cloud environments by tracking metrics that indicate response time, error rates, and other performance indicators. We believe it’s an essential component to getting full-scale observability of your platform by combining logs, metrics and distributed tracing to produce a bird’s eye view of system services’ health.
Does Logz.io support OpenTelemetry Protocol (OTLP)?
Yes, the Logz.io platform natively integrates with OpenTelemetry.


