
Telegraf Integrations with Logz.io
September 22, 2021

Logz.io is proud to announce a slew of new integrations via Telegraf. Logz.io utilizes Prometheus in its product, but aims to support compatibility across common DevOps tools. A number of our customers, and the community in general, are strong users of Telegraf and its companion apps in the TICK Stack (which includes InfluxDB).
Telegraf is not as popular as Prometheus, but it’s a strong element in the DevOps toolbox. Telegraf boasts an impressive collection of API integrations that run the gamut of the entire DevOps toolshed. It is written in Golang and also accommodates exporting metrics to a number of the same tools it pulls metrics from.
In addition to enabling these integrations, Logz.io now also has a dedicated dashboard for each of these products.
Now, thanks to the work of our Integrations Team, we have boosted support for these connections in Logz.io. Initially supported regions for Logz.io customers will include US East, EU Central, and EU West.
List of Telegraf Integrations
Logz.io will support about 70 new integrations via Telegraf. Here’s the list:
- ActiveMQ
- Aerospike
- Amazon ECS/Fargate
- Apache Aurora
- Apache HTTP Server
- Apache Mesos
- Apache Solr
- Apache Tomcat
- Zookeeper
- Bcache
- Beanstalkd
- Bigbluebutton
- Bind 9 Nameserver
- Bond
- Burrow
- Ceph
- Chrony
- Gnmi
- Clickhouse
- Couchdb
- Disque
- Dovecot
- Elasticsearch
- Fibaro
- Fireboard
- Github
- Google Cloud Pubsub
- Haproxy
- Influxdb
- Intel Powerstat
- Intel Rdt
- Ipmi Sensor
- Jenkins
- Jolokia
- Juniper Networks
- Knx
- Leofs
- Mailchimp
- Marklogic
- Mcrouter
- Memcached
- Dc/Os
- SQL Server
- Neptune Apex
- Nginx
- Nsd
- Nsq
- Nvidia
- Octoprint
- Pgbouncer
- Phfusion Passenger
- Phpfpm
- Puppet
- Rabbitmq
- Raindrops Middleware
- Ravendb
- Redfish
- Riak
- Siemens Plc
- Suricata
- Synproxy
- Tengine Webserver
- Twemproxy
- Uwsgi
- Unbound
- Windows
- Wireguard
- Zfs
- Youtube
Now let’s have a high level look at how these integrations work.
Installing Telegraf
First of all you need to decide where you are going to run Telegraf. The method for connecting will depend on your input source. This depends on the type of integration, such as having a dedicated remote server with Telegraf to collect metrics from various Youtube channels, or running Telegraf on the same machine for the sole purpose of collecting its system metrics.
As of this writing, the latest release is Telegraf v1.19. You’ll need at least Telegraf v1.17 or higher to feed data into Logz.io.
Regardless of the input source, all integrations start from here: installation. Here’s how to go about for various operating systems:
For Windows:
wget https://dl.influxdata.com/telegraf/releases/telegraf-1.19.2_windows_amd64.zipAfter downloading the archive, extract its contents into C:\Program Files\Logzio\telegraf\.
For MacOS:
brew install telegrafFor Linux:
Ubuntu & Debian:
sudo apt-get update && sudo apt-get install telegrafRedHat and CentOS:
sudo yum install telegrafSLES & openSUSE:
# add go repository
zypper ar -f obs://devel:languages:go/ go
# install latest telegraf
zypper in telegraf
FreeBSD/PC-BSD:
sudo pkg install telegrafAll Telegraf’s magic is orchestrated by the telegraf.config file. Its two main components are the Input plugins and Output plugins.
The configuration file is located at C:\Program Files\Logzio\telegraf\ on Windows, /usr/local/etc/telegraf.conf on MacOS and /etc/telegraf/telegraf.conf on Linux.
The custom component of each Telegraf integration is the inputs.<source> plugin. You can see the full list of Telegraf input plugins here (filter the list using the plugin type selection box).
To enable a plugin for your input source, you will simply need to copy and paste the plugin configuration into your Telegraf config file, while defining the system specifics, such as your host address, user credentials, etc. The detailed instructions on each plugin configuration can be found here.
The generic components for each integration is the outputs.http plugin. This is the place where you will need to define your account token and listener URL. If you intend to use one Logz.io account to receive metrics from all your Telegraf integrations, you will need to configure this plugin only once.
Once the plugins are configured, the only thing you need to do is to start Telegraf and go to your Logz.io account to see the data.
This is how you run Telegraf on various operating systems:
On Windows:
telegraf.exe --service startOn MacOS:
telegraf --config telegraf.confOn Linux:
Sysvinit and Upstart Installations
sudo service telegraf startSystemd Installations
systemctl start telegrafLogz.io Telegraf Dashboards
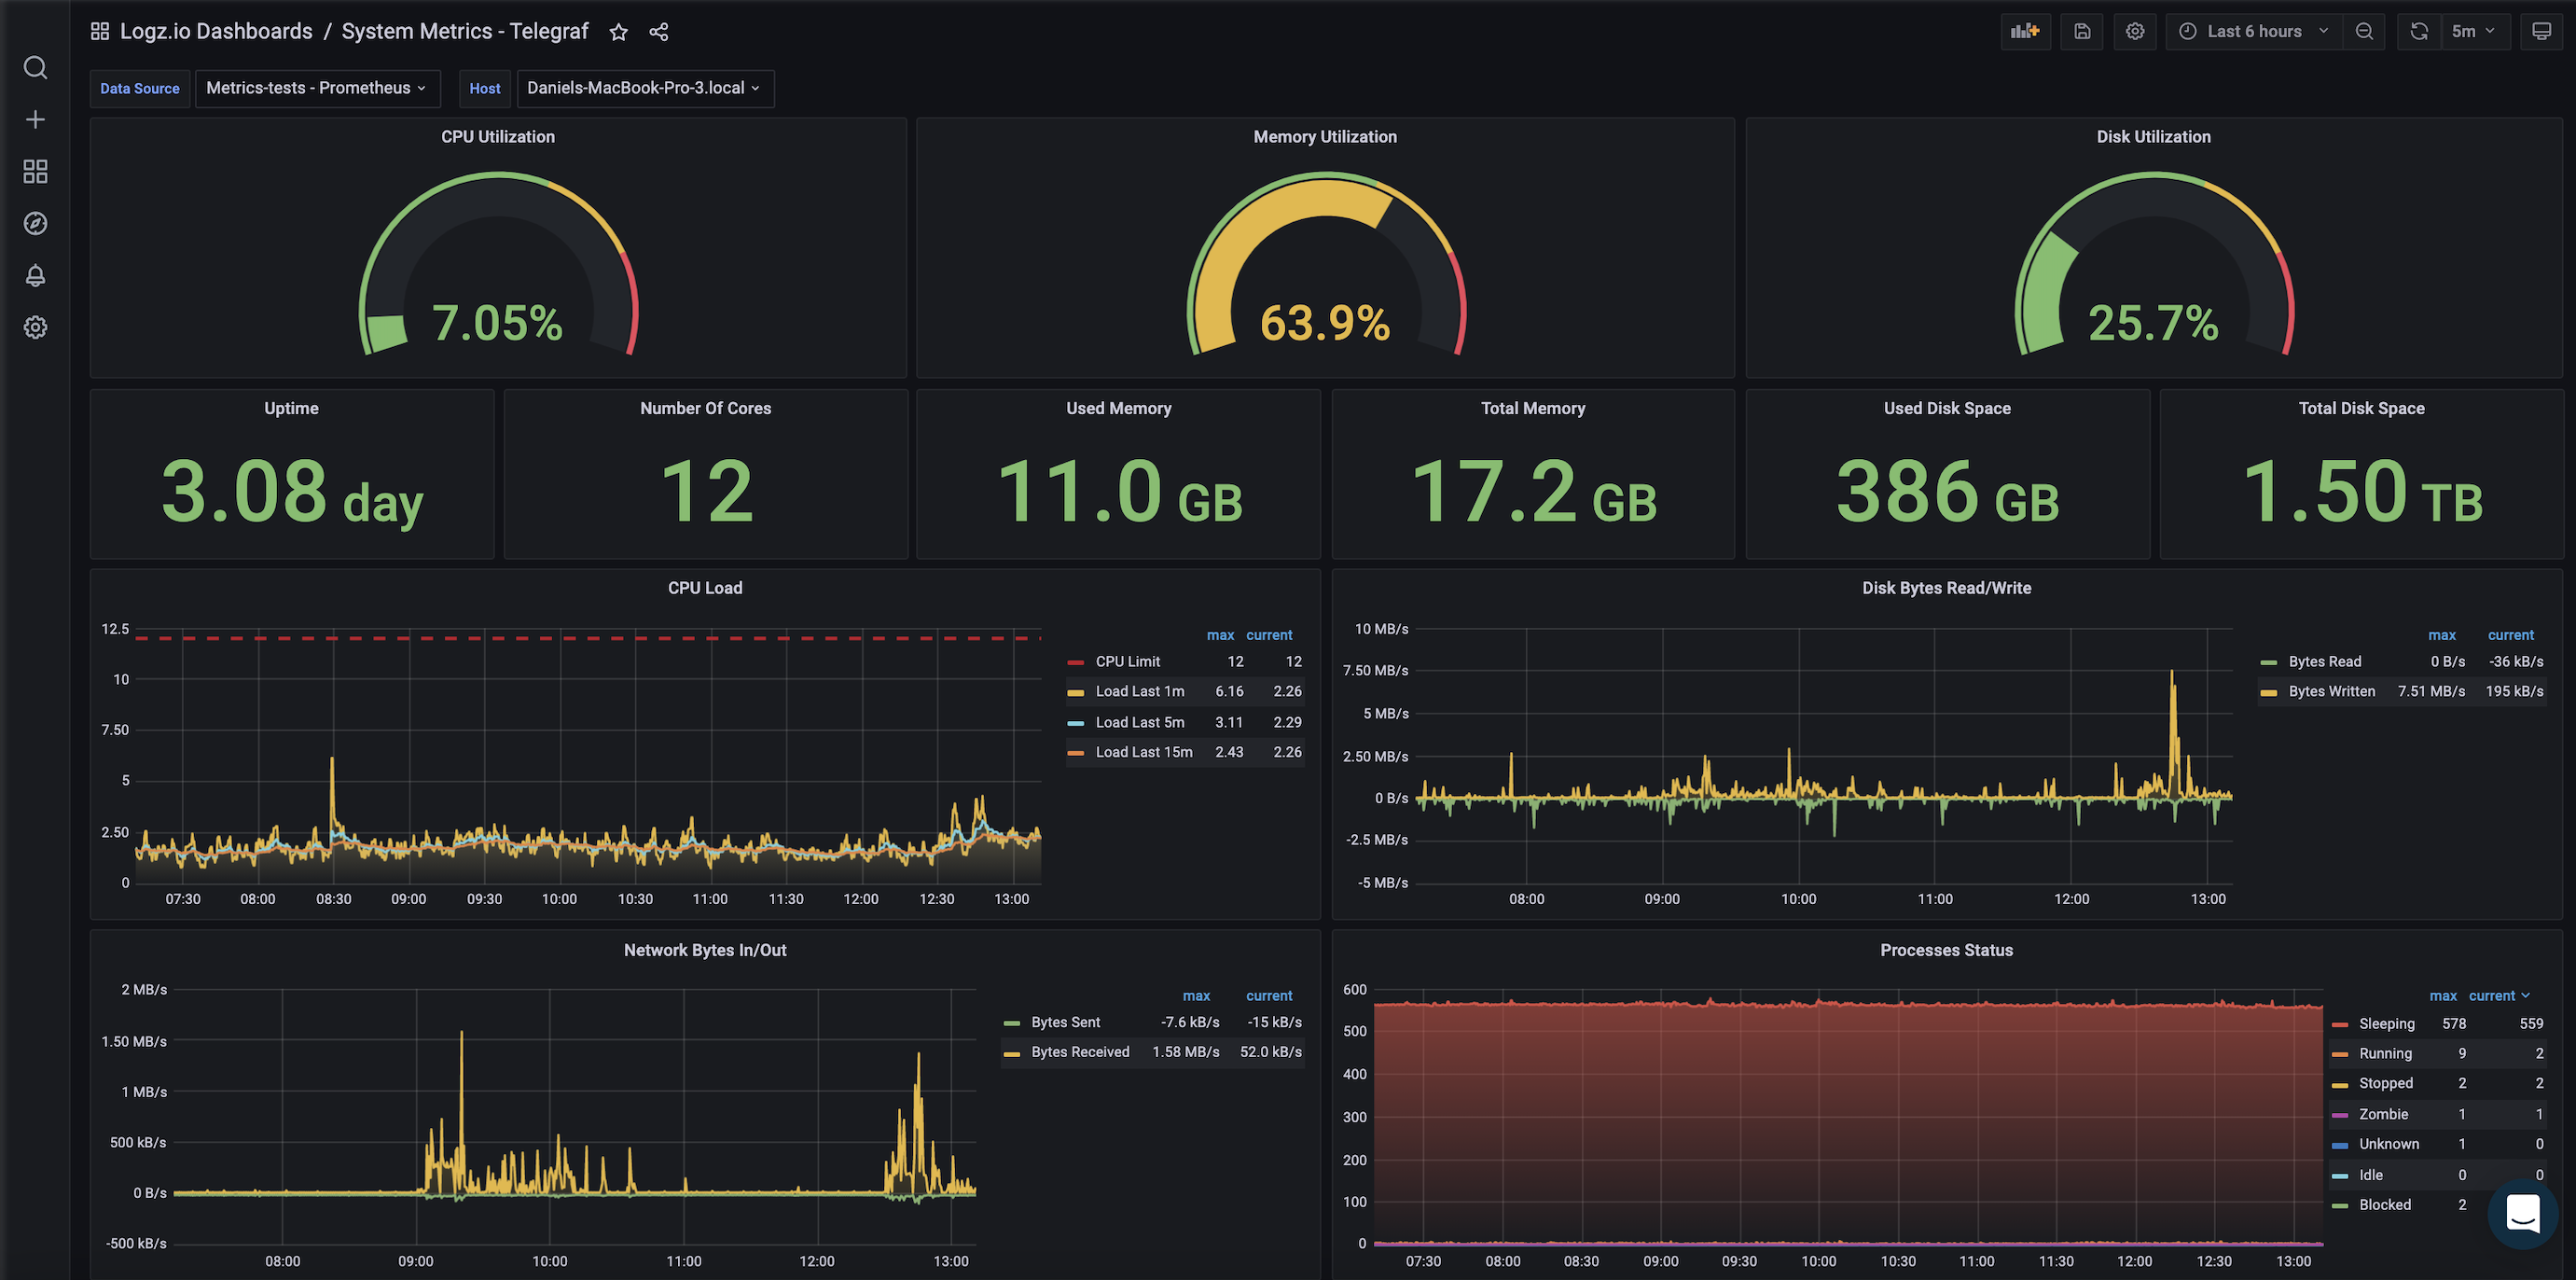
Logz.io has some prefabricated dashboards for Telegraf data, available for download within the Logz.io app. For example, you can look at this dashboard for Telegraf metrics in Prometheus format.

Stay Up to Date
Stay up to date with Logz.io as we continue to amplify our support for Telegraf and other popular monitoring and observability services. Subscribe to our blog for the latest product news, DevOps tutorials, and thoughts from tech leaders around the industry.

You Might Also Like

How to Gain Observability into Your CI/CD Pipeline

