
How Sisense Improves Product Self Service by Integrating Logz.io
October 31, 2017
Sisense offers a solution for collecting and analyzing BI (Business Intelligence) data. The Sisense product stack is comprised of a number of different components, including server and client-side services, all of which are monitored and logged using Logz.io’s ELK-based platform.More on the subject:
Logs form the basis of the monitoring system Sisense has constructed around the services it provides. The logs are collected using monitoring agents deployed on the customers’ machines together with the other stack components, and the Sisense Customer Success team uses this data to identify and troubleshoot any issue experienced by its users. Elaborate Kibana dashboards were built using Logz.io, helping Sisense to gain visibility into how the product is behaving on the client side.
Logging Sisense Services
Each of the different components comprising the Sisense server is responsible for a different process. These services generate different types of logs.
System log data is collected from the hosting machines in the users’ environment to be able to analyze server metrics such as memory, CPU and I/O. Query-related metrics, such as the time queries take and the size of the result set are logged to be able to analyze query performance and overall network traffic. Sisense-specific data is logged to be able to closely monitor the performance of queries and data collection processes (aka “builds”).
Used together, these different types of log data are used as the basis of Kibana dashboards. If, for example, there is an abnormal amount of slow queries, this metric can be cross-referenced with server-specific metrics to see if there is a memory or CPU issue.
In Comes the Sisense Monitor
To give users access to this log data and to allow them to easily monitor and troubleshoot potential issues with the services on their own, Sisense developed a new feature called Sisense Monitor — an embedded Kibana monitoring dashboard built using Logz.io –that can be accessed, viewed, and used by users.
As Ahuva Hazan-Fuchs, Product Manager at Sisense, puts it: “The Sisense Monitor is, in essence, a self-service tool, allowing our users to leverage Logz.io to easily see and troubleshoot issues.”
The dashboard is based on the different types of log data described above and contains a long list of visualizations.
Users can see a list of the machines hosting the Sisense server and filter all the data displayed in the monitor by a specific host. Likewise, they can filter the data by a specific timeframe.
They can see a general overview of the Sisense server — with pie chart visualizations showing successful/failed build and queries. They can drill down into a specific query if they like to find out more about why it failed for example.
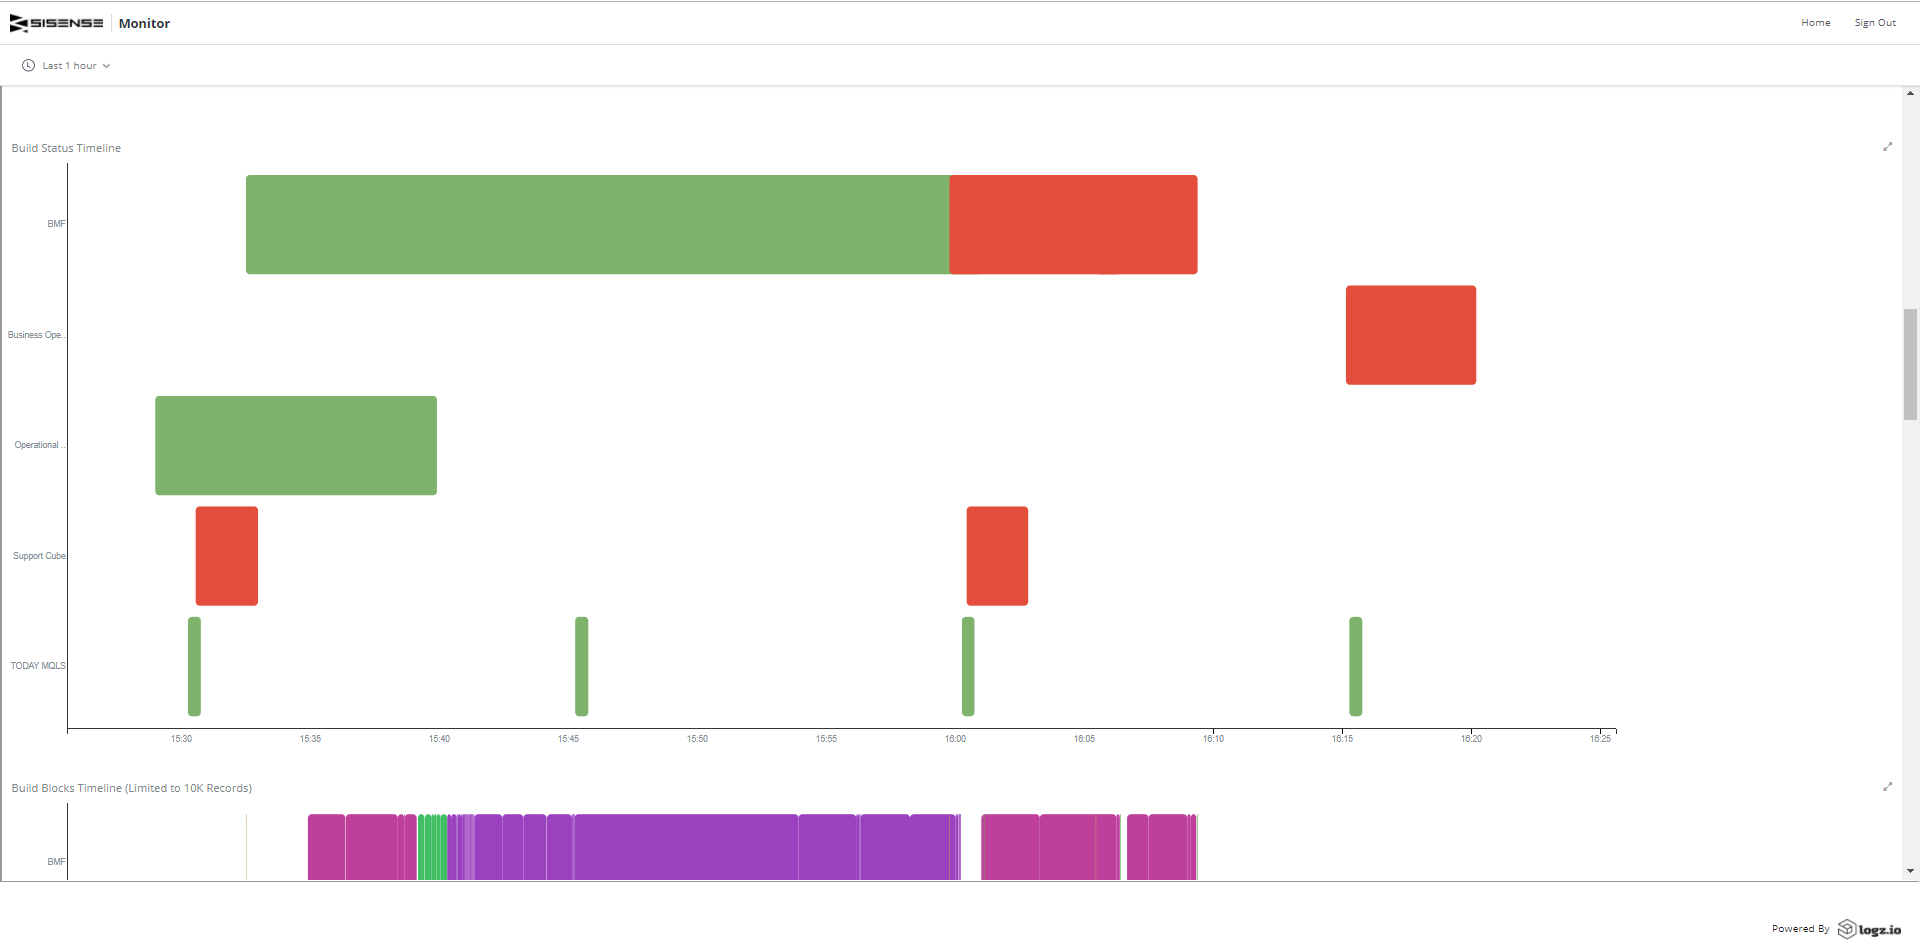
The extremely interesting Gantt chart visualizations allow users to see the different data collection processes being initiated. This offers the users an easy way to monitor parallel builds and optimize build schedule. Another Gantt chart allows them to drill down into the different stages of the build process
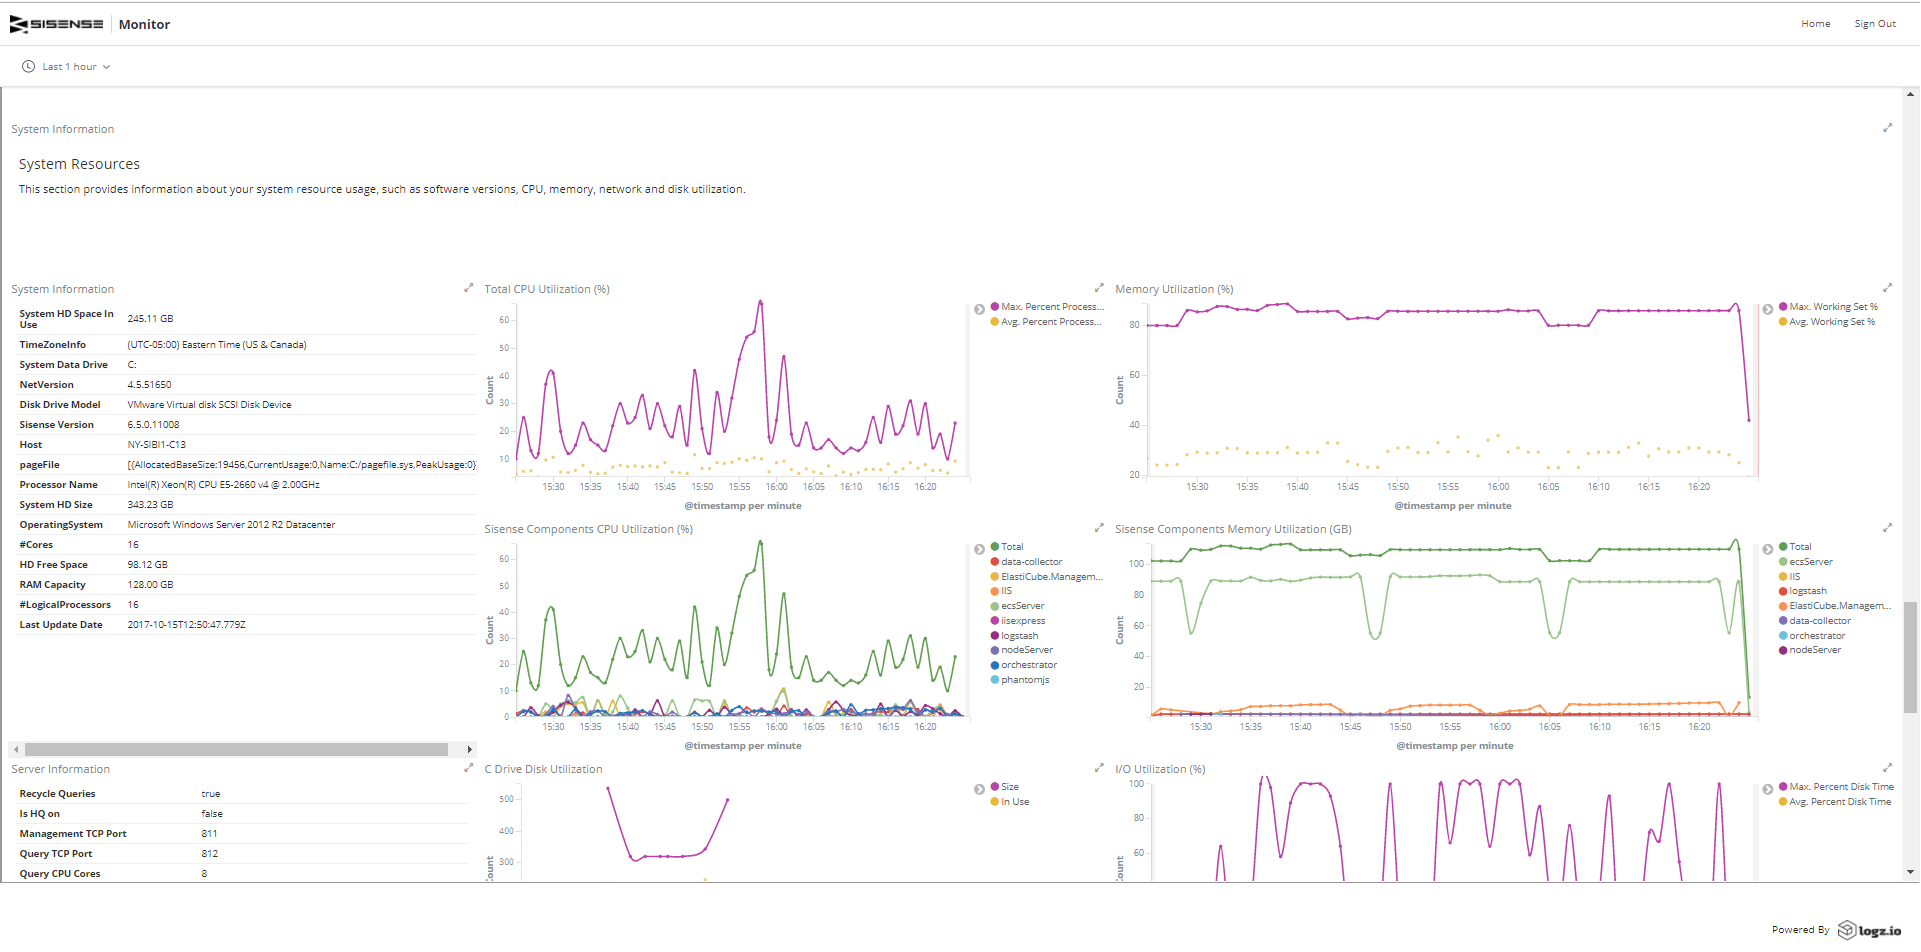
Server and host resource consumption and utilization has its own designated section in the dashboard, allowing Sisense users to monitor how the servers are performing in conjunction with Sisense-specific metrics
The Path to Self-Service
The new Sisense Monitor was designed to give users more monitoring and troubleshooting autonomy. By using the embedded Kibana dashboard, users are able to perform a lot of the work that was previously the sole responsibility of the Customer Support team.
This integration with Logz.io is a good example of how two data analysis platforms can be used in tandem to improve self-service and the overall supportability of a platform.

You Might Also Like

Introducing Logz.io’s New Lookz!

