Your Guide to Prometheus Observability
October 18, 2023
Imagine you’re piloting a spaceship through the cosmos, embarking on a thrilling journey to explore the far reaches of the universe. As the captain of this ship, you need a dashboard that displays critical information about your vessel, such as fuel levels, navigation data, and life support systems.
This dashboard is your lifeline, providing you with real-time insights about the health and performance of various systems within your ship, so you can quickly make critical decisions.
In the world of software and system monitoring, Prometheus serves as the technology that collects and stores data that you can present as an invaluable dashboard for developers and operations teams, guiding them through the intricate universe of observability.
The Impact of Prometheus on the Observability Universe
Prometheus is not a starship dashboard but rather an open-source infrastructure monitoring and alerting toolkit originally developed at SoundCloud. It has since evolved into a standalone project, operating independently under the nurturing wings of the Cloud Native Computing Foundation (CNCF).
Prometheus offers a multi-dimensional data model with time series data that can be identified by metric name and key-value pairs, a flexible query language, and perhaps most importantly, it operates without the need for distributed storage.
In the ever-expanding cosmos of monitoring tools, Prometheus stands out.
The Power of Prometheus
Let’s dive into the reasons why Prometheus has garnered such admiration and acclaim in the world of observability:
Simplicity for Cloud-Native Environments and Kubernetes. When trying to make sense of your infrastructure monitoring metrics, the complexity of cloud-native environments and the layers of abstraction presented by Kubernetes can present major challenges for organizations. Through its open source platform and native integrations, Prometheus provides simplicity for these use cases.
Mighty Query Language. Prometheus boasts a powerful query language, PromQL, that enables you to slice and dice data in ways that most other monitoring tools can only dream of. Prometheus provides an unparalleled ability for observability practitioners to perform calculations on the data and simplicity for basic queries.
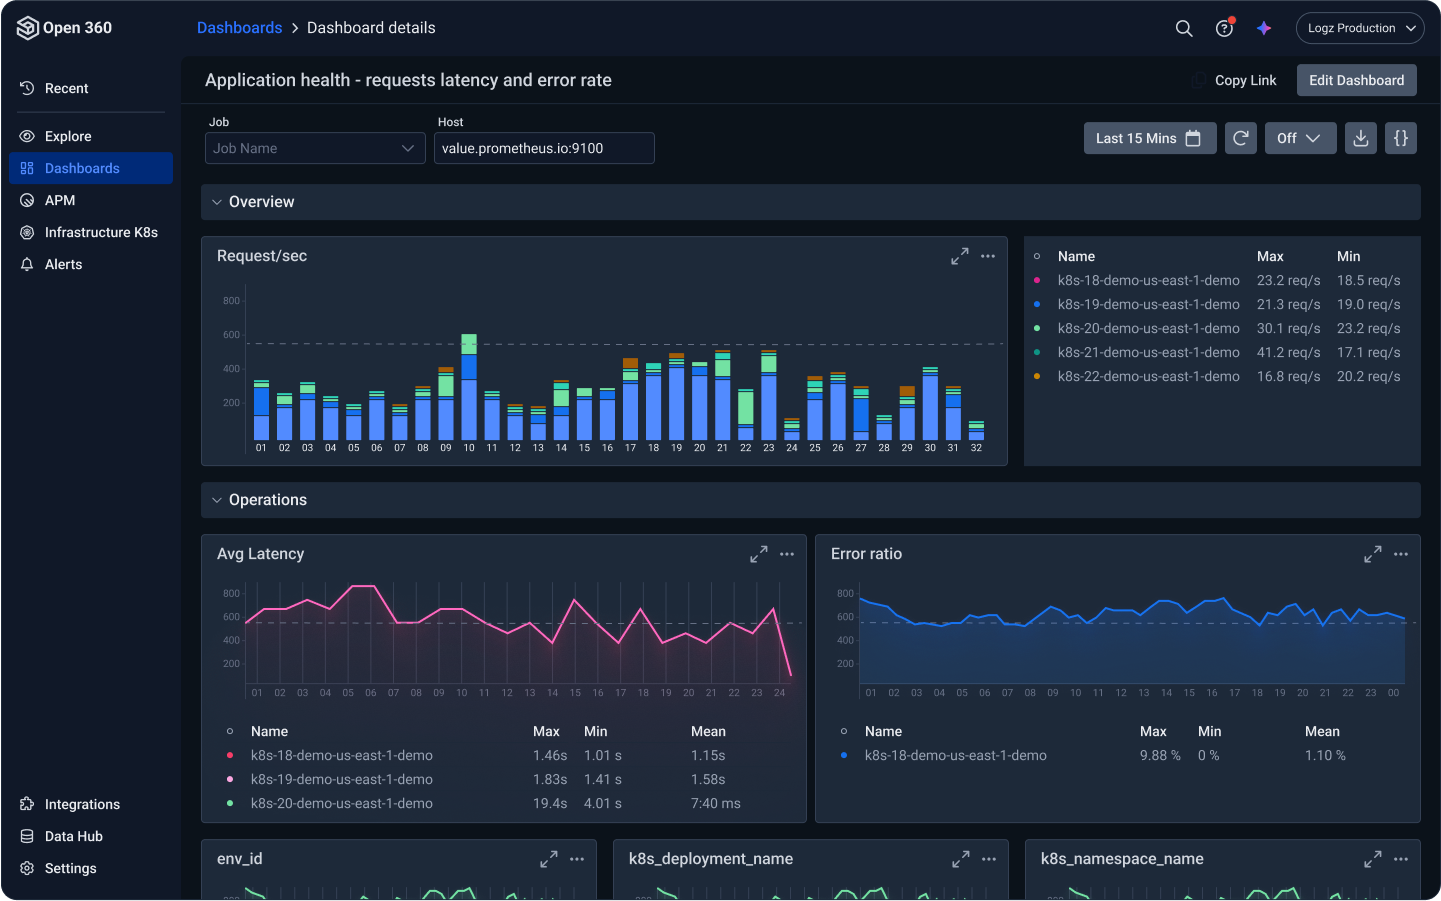
Visualization Features. Prometheus isn’t just about collecting data, it can paint vibrant visualizations. It pairs seamlessly with tools such as Grafana to create informative dashboards that help you understand your infrastructure’s performance at a glance.
Handling High Cardinality Data. In the land of microservices, the cardinality of your data skyrockets, making it a Herculean task for traditional monitoring tools. Prometheus, however, takes this challenge head-on, making it ideal for complex, modern infrastructures.
Prometheus Alertmanager. One critical component of Prometheus is Alertmanager, which “handles alerts sent by client applications such as the Prometheus server. It takes care of deduplicating, grouping, and routing them to the correct receiver integration such as email, PagerDuty, or OpsGenie. It also takes care of silencing and inhibition of alerts.” This reduces manual work for observability teams and simplifies the alerting process which if left unabated can cause major headaches.
The History and Evolution of Prometheus Observability
Prometheus’s journey began in 2012 when it was crafted at SoundCloud. At that time, the company was transitioning to a microservices architecture, and conventional monitoring tools couldn’t cope with the dynamic, ever-changing nature of this new landscape. Prometheus was born out of necessity, inspired by Google’s Borgmon monitoring system.
In 2015, Prometheus took a giant leap by becoming an open-source project available to the world.
The year 2016 saw Prometheus joining the prestigious CNCF as its second hosted project, right after Kubernetes. This was a pivotal moment in Prometheus’s evolution, as it started to gain widespread adoption and recognition.
Unpacking Prometheus Architecture and Metrics
To truly understand Prometheus, we must delve into its architecture and the types of metrics it handles.
Prometheus architecture. Prometheus employs a straightforward and robust architecture consisting of a single binary server per machine. These servers scrape data from various jobs over HTTP, ensuring that no valuable metrics escape their grasp. This pull-based model over HTTP is not only efficient but also incredibly versatile, allowing short-lived and batch jobs to be monitored with ease.
Metric types. Prometheus categorizes its metrics into four distinct types:
- Counter: Counters are used to represent monotonically increasing values, like the number of requests served by a web server. The value of a counter can only increase or be reset to zero when it is restarted—it will never decrease on its own. A counter metric in Prometheus can be used, for example, to show the number of errors or tasks completed depending on the use case.
- Gauge: Gauges measure values that can both increase and decrease, such as the current temperature or the amount of memory in use. Unlike a counter, a gauge can go up or down depending on what’s happening with the endpoint that’s being measured. For metrics being collected by the Prometheus client, this can include areas such as a number of concurrent requests or how much of a CPU is being utilized over a period of time.
- Histogram: Histograms capture data distribution. They’re handy for observing things like request response times, which can vary widely. As an example, a user may want to understand memory usage percent segmented by pods across a Kubernetes cluster in given points in time. The best way to do that is through a histogram.
- Summary: Summaries provide information about the distribution of observed values and allow you to calculate quantiles and other percentile values. They mainly cover service level indicators, as they offer a gauge of histograms, specifically of limited selections (quantiles) of a range of values. Summaries calculate streaming quantiles on the client side and expose them directly, which is the chief difference between summaries and histograms
The Fall of Traditional Monitoring Tools and the Rise of Prometheus Observability
Before Prometheus arrived on the scene, traditional monitoring tools often faced insurmountable challenges in cloud-native environments. Their Achilles’ heel was their inability to adapt to the ephemeral nature of modern infrastructure, their struggle with high cardinality data, and their inability to automate monitoring tasks.
Prometheus, on the other hand, simplifies integrations with Kubernetes-based environments compared to other monitoring tools. It’s also built to handle the enormous amount of high cardinality data generated by Kubernetes and microservices, making it the superhero of modern system observability.
Now, let’s explore how Prometheus and another powerful tool, Logz.io, can be combined to create a scalable and comprehensive monitoring setup.
Scaling Up with Logz.io and Prometheus
As great as Prometheus is, there is one significant issue: scale. Prometheus runs on a single machine and periodically connects to an endpoint on each of the containers, servers, and VMs it’s monitoring. Large organizations running multiple instances of each of hundreds of microservices quickly exceed the scraping capabilities of a single Prometheus server. This can cause major scaling issues, and requires third party help.
Logz.io provides Open 360™, an essential observability platform that offers the ability to harness the power of top-tier open source tools without the high cost of most proprietary vendors. Our platform provides advanced analytics to supercharge the observability tools you love, making them faster, more integrated, and easier to use.
Integrating Logz.io with Prometheus is a match made in observability heaven. With Logz.io, you can store and analyze Prometheus metrics so you can easily identify and fix performance issues. Logz.io offers a unique Prometheus-as-a-Service setup that takes away headaches and allows you to use Prometheus as a managed service.
You’ll also unify your Prometheus metrics data alongside log and trace data, a critical capability for your essential observability practice. Our data optimization features cut costs so you only pay for the metrics you need.
This partnership opens up new dimensions in monitoring and alerting, making it easier for teams to navigate the complex universe of modern infrastructure.
Getting Started with Logz.io
If you’re eager to embark on your Prometheus observability journey with Logz.io, here are some steps to get you started:
Set Up Your Environment. Logz.io provides detailed documentation to help you set up Prometheus with their platform.
If you’re already using Prometheus to pull metrics from your services, you can leverage your current implementation to forward metrics to Logz.io for fast time-to-value.
We store your metrics in our managed service, which cuts most of your metrics retention burden.
And if you have multiple Prometheus instances, we take on the maintenance tasks to ensure there’s enough storage space, as well as upgrading, securing, and sharding Prometheus.
Sign Up. The first step is to create an account on Logz.io. It’s free to sign up for a trial here.
Follow our docs to ensure a smooth integration.
Collect Metrics. Configure Prometheus to send your metrics to Logz.io using the provided settings. This step is crucial for getting the most out of your observability setup. Learn more from our docs.
All it takes to ship your metrics data to Logz.io is to use Remote Write on each Prometheus server, with Logz.io configured as the endpoint: By adding a few lines of code, Remote Write ensures that your metrics are written to Logz.io.
Visualize and Analyze. Once the metrics are flowing into Logz.io, you can start creating custom dashboards, visualizations, and alerts to keep a close eye on your system’s performance. You can also unify and correlate metrics with your logs and tracing data for full observability.
Your data is formatted as JSON documents by the Logz.io listener. For the trial program, your incoming raw data has a 30-day retention period.
Once your metrics are flowing, import your existing Prometheus and Grafana dashboards to Logz.io Infrastructure Monitoring as JSON files.
Best Practices for Prometheus Observability
To make the most of Prometheus, here are some best practices to follow:
Design Your Dashboards Around SLOs. Service Level Objectives (SLOs) are key performance indicators for your services. Your dashboards should align with your SLOs, making it easier to monitor and maintain your system’s performance. Here’s more on SLOs in the era of the SRE.
Harness Prometheus’s Powerful Query Language. As discussed before, PromQL is your secret weapon. Learn to craft effective queries that provide the precise information you need, and use it to create custom alerts that help you stay ahead of potential issues.
Regularly Evaluate and Update Alerting Rules. Don’t set your alerting rules in stone. Your system evolves, so should your alerting strategy. Regularly review and update your rules to ensure they remain relevant.
Leverage Labels for Contextual Insights. Labels are Prometheus’s way of adding context to your time series data. Use labels effectively to provide meaningful information about your metrics, making it easier to understand and troubleshoot issues.
Get Started With Prometheus Observability as a Service Today!
Prometheus observability is not just a tool; it’s a guiding star in the vast universe of monitoring and alerting. Its ability to handle the complexities of modern, cloud-native infrastructures makes it a valuable asset for any organization. When paired with Logz.io, Prometheus becomes even more potent, offering unparalleled insights and analysis capabilities as a managed service.
So, don’t wait. Harness the power of Prometheus observability and Logz.io today. Empower your team with the knowledge and tools they need to navigate the cosmos of modern infrastructure confidently. Sign up for a free trial and get started now!


