Product Spotlight: Logz.io Service Performance Monitoring
September 19, 2022

We believe that one of the most powerful capabilities added to the Logz.io Observability Platform in recent months is our new Service Performance Monitoring (SPM) feature set.
As you may have seen earlier this year, Logz.io was named a Visionary in the 2022 Gartner® Magic Quadrant(™) for Application Performance Monitoring and Observability. To that end, SPM is a cornerstone for our related solutions. This core functionality engages the full observability power of Logz.io by combining logs, metrics and distributed tracing to produce a bird’s eye view of system services’ health.
Distributed Tracing is Critical for Determining Systems Health
Continuous improvement is the typical mindset among teams that build and support large-scale modern software systems and technologies. The result of this approach is the creation of super flexible applications that can scale quickly using microservices and serverless technologies. Yet, at the same time, this strategy also consistently increases the complexity of cloud applications and infrastructure while most often obscuring visibility for engineering and monitoring teams.
This all makes it difficult to track requests as they propagate through the various parts of a system to quickly isolate where errors occur, or to pinpoint what is taking the most time to execute. Over time, it then becomes impossible to go through ALL the logs in a specific timeframe to enable troubleshooting. Even the process of slowly filtering relevant logs becomes very difficult, as the amount of data involved is enormous.
This is where Distributed Tracing proves hugely applicable as it aims to provide the missing visibility required to troubleshoot and monitor such applications. By merely adding a layer of instrumentation to your code, trace data is then collected systematically to provide a strong foundation for application performance analysis and monitoring. Distributed Tracing specifically tracks requests paths and maps them to the different parts of your application.
SPM and the Logz.io Approach to Distributed Tracing
Logz.io first launched Distributed Tracing with its announcement of support for Jaeger as a service. This is part of our long-term commitment to, and involvement with open source software as Jaeger is a graduated CNCF project; combined with OpenTelemetry these capabilities offer the core functionality required for distributed tracing.
Doubling down on its commitment to open source, Logz.io has also developed and contributed a set of components to help close this gap and increase the ability for users to monitor specific application services.
Meanwhile, as adoption of tracing has grown, so has the need for an aggregated layer view of system services. Individual traces are great for use in examining bottlenecks, but it’s very difficult and time consuming to use tracing alone to understand overall application performance. This is where SPM comes in handy.
Our SPM technology uses the same telemetry data sent to the distributed tracing backend to extract and aggregate application metrics. This is achieved with a simple configuration change to the open source OpenTelemetry collector, and then extracted metrics can be transmitted and stored on a Prometheus-based datasource as part of the Logz.io observability platform.
How Do I Start?
To get started with Logz.io using SPM, merely open a Logz.io account and engage the Distributed Tracing trial. Once your application is instrumented and trace data is sent to Logz.io, you can activate Service Performance Monitoring with a click of a button. Activation includes everything needed to create a metrics data source that will store trace data and aggregated metrics, side-by-side.
Follow instructions on the tracing docs to make the necessary modifications to the OpenTelemetry collector, to start extracting RED metrics from your traces. Once metrics are configured properly you’ll be able to examine the SPM dashboard, focus on specific services, and timeframes and get a better understanding on the overall performance of your microservices.
For existing customers, using Service Performance Monitoring requires a Logz.io Distributed Tracing account, an application instrumented to send trace data (spans) and an OpenTelemetry collector configured with your Logz.io account credentials.
Putting SPM into Action
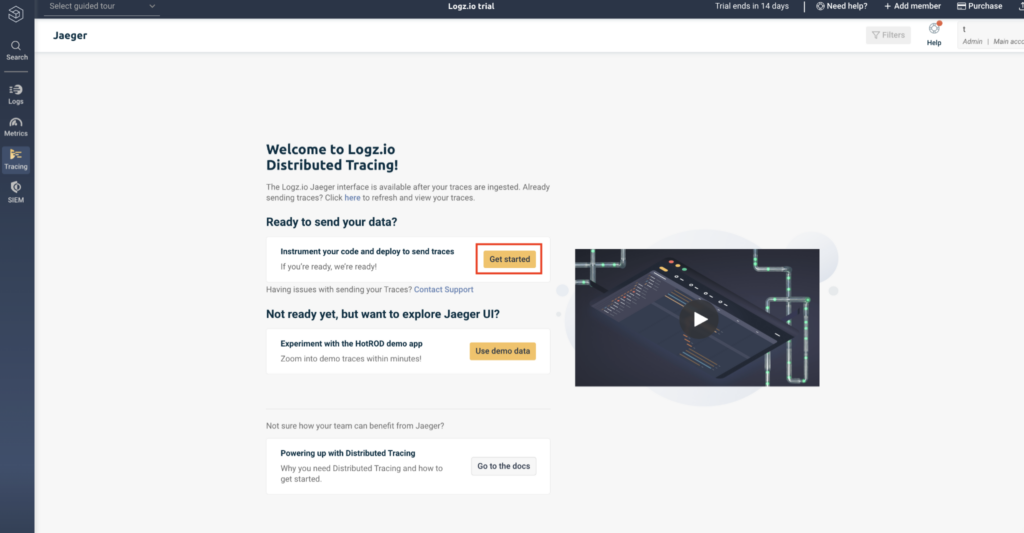
If you already can see your traces in the Logz.io Distributed Tracing product, within the Jaeger UI, you can skip to the next section.
If you don’t already use Tracing, head over to our Free Trial page to start your free Logz.io account.
Once created, select the Distributed Tracing option, and “Start using Distributed Tracing”

Next, you’ll need to instrument your code. Start with auto instrumentation. It’s the easiest way to start. Detailed instructions are available for all the major languages.
Select your programming language of choice. Auto instrumenting your code should be easy and normally involves very few steps outlined in every one of our docs.

Next, you’ll need to deploy an OpenTelemetry collector. OpenTelemetry is an industry standard developed by the open source community in order to streamline aggregation of different telemetry types. For Kubernetes environments you can select to use the Logz.io Data Collector that will simplify that process.

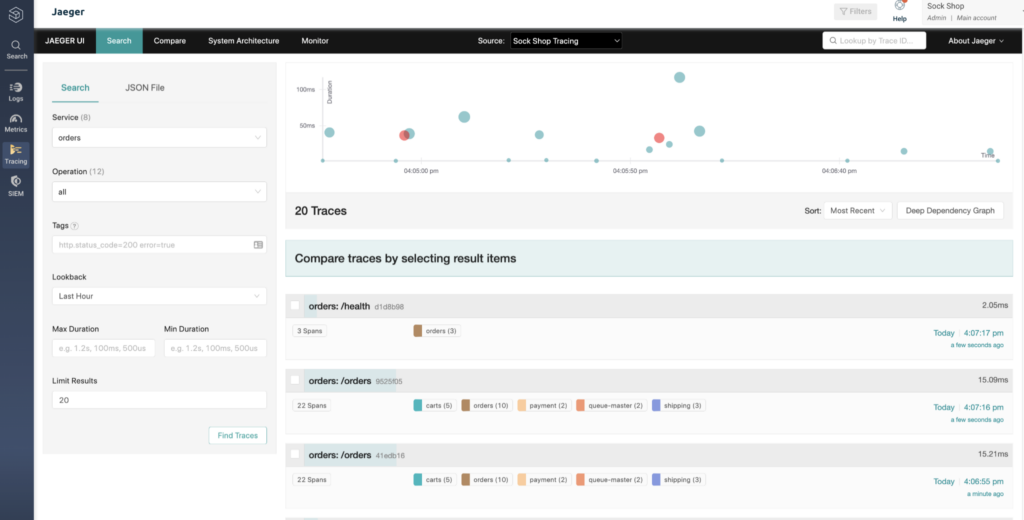
Once the OTEL collector is fully deployed and configured with your Distributed Tracing token you should see traces in your Jaeger display.
Activating Service Performance Monitoring
Once you confirm that traces flow into your Logz.io Distributed Tracing console you are now ready to take the next step. Conveniently, activating SPM will quickly allow you to start gathering metric data on your services from the SAME trace data you already configured in Logz.io.
First, checkout the “Monitor” tab on your Jaeger UI.

Activating the SPM dashboard is easily done by clicking “Start now”. Logz.io will automatically link your distributed tracing account with a Prometheus data source. This data source is used to store the metric data extracted from your traces.
After activation all you need to do is modify the OTEL collector configuration to apply the spanmetrics processor on your trace data. This processor was developed by Logz.io and contributed to OpenTelemetry. It taps on the same trace data that is going through the collector and extracts the relevant Latency, Error rate and Throughput metrics. Use our detailed documentation to add some configuration to your existing collector yaml or use the provided helm chart.
Once your configuration changes and your collector restarted, metrics data will start flowing into your Service Performance Monitoring dashboard.

So there you have it, now you’re using SPM as an element of Observability and Distributed Tracing. Whether you’re new to this type of monitoring, or you’re a longstanding APM practitioner looking for something different – based on leading open source – to address your modern apps and infrastructure, we think you’ll appreciate significant value out of this capability.
For more on Logz.io’s approach to Distributed Tracing and APM, check out this recent blog post by our CTO Jonah Kowall.
If you want to learn more about how Logz.io provides SPM, don’t miss our webinar, “Destroy Data Bottlenecks with Distributed Tracing,” featuring Dotan Horovits and myself. Choose a webinar session on Sept. 20 or 21, 2022 depending on your time zone!

You Might Also Like
Secure Your Endpoints with ESET and Logz.io

