
Web Server Monitoring Your Application on Nginx with Logz.io

A big topic of interest nowadays is web application monitoring. Application performance monitoring and log analytics are required by businesses of all sizes to ensure their web applications’ smooth operation. If your application serves as the backend for your business processes, it is critical for your organization. You need to know, in real-time, when and why it breaks.
To answer these questions, we will use Logz.io products to monitor a simple web application served by Nginx. For Apache-based configuration, have a look at this article.
Nginx is one of the best-performing and most used web server/reverse proxy in the world. With robust and advanced configuration options, it was chosen by many since its inception in 2004.
More on the subject:
This article will explore options to monitor our web application that is served by an Nginx web server using many of the Logz.io tools. Logz.io’s Prometheus-as-a-Service will allow us to collect and store our metrics while using visualizing them in our Metrics UI; we will be able to create dashboards and graphs of that data.
Also, logs from our system and Nginx will be transported into the Logz.io servers, so we can search and access logs, all without installing anything except the agents.
Web Application Served by Nginx
We are going to use Nginx as a web server and serve the default Nginx static page as an application.
The important part here is to gather the metrics from Nginx. For this, we will expose metrics and use Nginx Prometheus Exporter to collect them.
Our main instance of Prometheus will scrape the metrics from the exporters and write the data to a Logz.io Prometheus as a Service instance where we can use built-in metrics UI to create and view dashboards.
Installing Nginx
You can skip this ‘Installing Nginx’ section if you already have it installed.
Installing Nginx on an Ubuntu server is pretty straightforward using the apt command:
apt install -y nginx
Command will display an output similar to the one below.
Reading package lists... Done
Building dependency tree
Reading state information... Done
The following NEW packages will be installed:
  nginx
0 upgraded, 1 newly installed, 0 to remove and 0 not upgraded.
Need to get 3,624 B of archives.
After this operation, 45.1 kB of additional disk space will be used.
Get:1 http://ubuntu.mirror.serverloft.eu/ubuntu focal-updates/main amd64 nginx all 1.18.0-0ubuntu1 [3,624 B]
Fetched 3,624 B in 1s (2,966 B/s)
Selecting previously unselected package nginx.
(Reading database ... 75337 files and directories currently installed.)
Preparing to unpack .../nginx_1.18.0-0ubuntu1_all.deb ...
Unpacking nginx (1.18.0-0ubuntu1) ...
Setting up nginx (1.18.0-0ubuntu1) ...
Enable systemd to start Nginx service at boot.
systemctl enable nginx
Command will display the following output.
Synchronizing state of nginx.service with SysV service script with /lib/systemd/systemd-sysv-install.
Executing: /lib/systemd/systemd-sysv-install enable nginx
Now, we are ready to start the Nginx server.
systemctl start nginx
Let’s check the status of the web server.
systemctl status nginx
We can confirm that our web server is running.
● nginx.service - A high performance web server and a reverse proxy server
     Loaded: loaded (/lib/systemd/system/nginx.service; enabled; vendor preset: enabled)
     Active: active (running) since Fri 2021-02-19 15:40:43 CET; 24h ago
       Docs: man:nginx(8)
   Main PID: 1480738 (nginx)
      Tasks: 9 (limit: 18994)
     Memory: 9.2M
     CGroup: /system.slice/nginx.service
             ├─1480738 nginx: master process /usr/sbin/nginx -g daemon on; master_process on;
             ├─1480739 nginx: worker process
             ├─1480741 nginx: worker process
             ├─1480742 nginx: worker process
             ├─1480743 nginx: worker process
             ├─1480744 nginx: worker process
             ├─1480745 nginx: worker process
             ├─1480746 nginx: worker process
             └─1480747 nginx: worker process

Feb 19 15:40:43 valhalla systemd[1]: Starting A high performance web server and a reverse proxy server...
Feb 19 15:40:43 valhalla systemd[1]: Started A high performance web server and a reverse proxy server.
Configuring Nginx
Nginx comes with a default site configuration, which is sufficient for testing.
However, we need to configure the Nginx process to expose some metrics first. These metrics will be scrapped by the Nginx Prometheus Exporter and then by Prometheus.
sudo nano /etc/nginx/sites-available/stub_status.conf
Paste the following configuration into the editor.
server {
	listen 10080;
	listen [::]:10080;
  location / {
  	stub_status;
  }
}
Create a symlink in sites-enabled.
ln -s /etc/nginx/sites-available/stub_status.conf /etc/nginx/sites-enabled/
Now, restart the Nginx service via the systemctl command.
sudo systemctl restart nginx
Test the exporter endpoint.
curl http://localhost:10080/
A sample output is shown below.
Active connections: 2
server accepts handled requests
 67 67 4467
Reading: 0 Writing: 1 Waiting: 1
Installing Filebeat
First, let’s download Filebeat.
curl -L -O https://artifacts.elastic.co/downloads/beats/filebeat/filebeat-7.10.0-amd64.deb
We will use dpkg to install the downloaded package.
sudo dpkg -i filebeat-7.10.0-amd64.deb
Similar output to the following will be displayed:
Selecting previously unselected package filebeat.
(Reading database ... 76755 files and directories currently installed.)
Preparing to unpack filebeat-7.10.0-amd64.deb ...
Unpacking filebeat (7.10.0) ...
Setting up filebeat (7.10.0) ...
Processing triggers for systemd (245.4-4ubuntu3.4) ...
We need the CA certificate as well.
sudo curl https://raw.githubusercontent.com/logzio/public-certificates/master/AAACertificateServices.crt --create-dirs -o /etc/pki/tls/certs/COMODORSADomainValidationSecureServerCA.crt
Configuring Filebeat
We will configure the Filebeat, open the configuration file with your favorite editor, here we are using Nano.
sudo nano /etc/filebeat/filebeat.yml
Paste the following into the file; before pasting, please replace "<PASTE YOUR LOG TOKEN>" with your token.
filebeat.inputs:
- type: log
  enabled: true
  paths:
    - /var/log/*
  fields:
    logzio_codec: plain
    token: <PASTE YOUR LOG TOKEN>
    type: nginx_access
  fields_under_root: true
  encoding: utf-8
  ignore_older: 3h

- type: log
  paths:
  - /var/log/nginx/access.log
  fields:
    logzio_codec: plain
    token: <PASTE YOUR LOG TOKEN>
    type: nginx_access
  fields_under_root: true
  encoding: utf-8
  ignore_older: 3h

- type: log
  paths:
  - /var/log/nginx/error.log
  fields:
    logzio_codec: plain
    token: <PASTE YOUR LOG TOKEN>
    type: nginx_error
  fields_under_root: true
  encoding: utf-8
  ignore_older: 3h

filebeat.registry.path: /var/lib/filebeat
processors:
- rename:
    fields:
    - from: "agent"
      to: "filebeat_agent"
    ignore_missing: true
- rename:
    fields:
    - from: "log.file.path"
      to: "source"
    ignore_missing: true

output.logstash:
  hosts: ["listener.logz.io:5015"]
  ssl:
    certificate_authorities: ['/etc/pki/tls/certs/COMODORSADomainValidationSecureServerCA.crt']
This configuration defines three inputs: 1) for all the log files that are under /var/log/ and have .log extension, 2) the access log for Nginx, and 3) the error log for Nginx.
Once the configuration is applied, we need to restart the service to take effect:
systemctl restart filebeat
Let’s check the status of the service.
systemctl status filebeat
Filebeat is running as expected; we can see that several files are being monitored in the logs.
● filebeat.service - Filebeat sends log files to Logstash or directly to Elasticsearch.
     Loaded: loaded (/lib/systemd/system/filebeat.service; enabled; vendor preset: enabled)
     Active: active (running) since Fri 2021-02-19 22:02:14 CET; 3s ago
       Docs: https://www.elastic.co/products/beats/filebeat
   Main PID: 1485116 (filebeat)
      Tasks: 16 (limit: 18994)
     Memory: 63.6M
     CGroup: /system.slice/filebeat.service
             └─1485116 /usr/share/filebeat/bin/filebeat --environment systemd -c /etc/filebeat/filebeat.yml --path.home /usr/share/filebeat --path.config /etc/filebeat --path.data /var/lib/filebeat --path.logs /var/log/fileb>

Feb 19 22:02:15 valhalla filebeat[1485116]: 2021-02-19T22:02:15.692+0100        INFO        log/harvester.go:302        Harvester started for file: /var/log/ubuntu-advantage.log
Feb 19 22:02:15 valhalla filebeat[1485116]: 2021-02-19T22:02:15.692+0100        INFO        log/harvester.go:302        Harvester started for file: /var/log/auth.log
Installing Prometheus
Installing Prometheus is also quite straight forward by using apt command, as follows:
apt install -y prometheus
Following is the from apt command.
...
...
Setting up javascript-common (11) ...
Setting up libjs-popper.js (1.16.0+ds2-1) ...
Setting up libio-pty-perl (1:1.12-1) ...
Setting up fonts-glyphicons-halflings (1.009~3.4.1+dfsg-1) ...
Setting up libjs-moment (2.24.0+ds-2) ...
Setting up libc-ares2:amd64 (1.15.0-1build1) ...
Setting up prometheus-node-exporter (0.18.1+ds-2) ...
Created symlink /etc/systemd/system/multi-user.target.wants/prometheus-node-exporter.service → /lib/systemd/system/prometheus-node-exporter.service.
Setting up libjs-d3 (3.5.17-2) ...
Setting up libnode64:amd64 (10.19.0~dfsg-3ubuntu1) ...
Setting up libjs-moment-timezone (0.5.28+dfsg1-1) ...
Setting up libipc-run-perl (20180523.0-2) ...
Setting up libtime-duration-perl (1.21-1) ...
Setting up nodejs-doc (10.19.0~dfsg-3ubuntu1) ...
Setting up libtimedate-perl (2.3200-1) ...
Setting up libjs-bootstrap4 (4.4.1+dfsg1-2) ...
Setting up libjs-jquery (3.3.1~dfsg-3) ...
Setting up libjs-mustache (2.3.2-1) ...
Setting up libjs-jquery-hotkeys (0~20130707+git2d51e3a9+dfsg-2ubuntu1) ...
Setting up libjs-bootstrap (3.4.1+dfsg-1) ...
Setting up libjs-eonasdan-bootstrap-datetimepicker (4.17.47-3) ...
Setting up moreutils (0.63-1) ...
Setting up nodejs (10.19.0~dfsg-3ubuntu1) ...
update-alternatives: using /usr/bin/nodejs to provide /usr/bin/js (js) in auto mode
Setting up libjs-rickshaw (1.5.1.dfsg-2) ...
Setting up node-jquery (3.4.0+dfsg-1) ...
Setting up prometheus-node-exporter-collectors (0+git20200110.fc91c86-1) ...
Created symlink /etc/systemd/system/timers.target.wants/prometheus-node-exporter-apt.timer → /lib/systemd/system/prometheus-node-exporter-apt.timer.
Created symlink /etc/systemd/system/timers.target.wants/prometheus-node-exporter-ipmitool-sensor.timer → /lib/systemd/system/prometheus-node-exporter-ipmitool-sensor.timer.
Created symlink /etc/systemd/system/timers.target.wants/prometheus-node-exporter-mellanox-hca-temp.timer → /lib/systemd/system/prometheus-node-exporter-mellanox-hca-temp.timer.
Created symlink /etc/systemd/system/timers.target.wants/prometheus-node-exporter-smartmon.timer → /lib/systemd/system/prometheus-node-exporter-smartmon.timer.
Setting up prometheus (2.15.2+ds-2) ...
Created symlink /etc/systemd/system/multi-user.target.wants/prometheus.service → /lib/systemd/system/prometheus.service.
Processing triggers for systemd (245.4-4ubuntu3.4) ...
Processing triggers for man-db (2.9.1-1) ...
Processing triggers for libc-bin (2.31-0ubuntu9.1) ...
Installing Prometheus Node Exporter
The Prometheus Node Exporter package was installed when we installed the Prometheus package, therefore no need to do anything.
Install Nginx Prometheus Exporter
There is no apt package for Nginx Prometheus Exporter, so we will download the binary and create a systemd service to manage it.
First, let’s download the Nginx Prometheus Exporter binary:
Tip: Change the version tag to your selected version.
curl -OL https://github.com/nginxinc/nginx-prometheus-exporter/releases/download/v0.8.0/nginx-prometheus-exporter-0.8.0-linux-amd64.tar.gz
Extract it with tar command.
tar -zxvf nginx-prometheus-exporter-0.8.0-linux-amd64.tar.gz
Next, add a system user for Nginx Prometheus Exporter.
useradd -r nginx-prometheus-exporter
Next, move the binary to /usr/local/bin/ so that it is in our path.
mv nginx-prometheus-exporter /usr/local/bin/
Then, prepare the systemd service file:
sudo nano /etc/systemd/system/nginx-prometheus-exporter.service
Then paste the following:
[Unit]
Description=nginx-prometheus-exporter
After=network.target

[Service]
Type=simple
User=nginx-prometherus-exporter
ExecStart=/usr/local/bin/nginx-prometheus-exporter -nginx.scrape-uri http://127.0.0.1:10080/
Restart=on-failure

[Install]
WantedBy=multi-user.target
Next, trigger the reload of the daemon files.
systemctl daemon-reload
Finally, enable Nginx Prometheus Exporter service at boot.
systemctl enable nginx-prometheus-exporter.service
An output similar to the following will be displayed:
Created symlink /etc/systemd/system/multi-user.target.wants/nginx-prometheus-exporter.service → /etc/systemd/system/nginx-prometheus-exporter.service.
Let’s start the service now:
systemctl start nginx-prometheus-exporter.service
Let’s look at the service status to make sure all is good.
systemctl status nginx-prometheus-exporter.service
We can see that service is running.
● nginx-prometheus-exporter.service - nginx-prometheus-exporter
     Loaded: loaded (/etc/systemd/system/nginx-prometheus-exporter.service; enabled; vendor preset: enabled)
     Active: active (running) since Fri 2021-02-19 21:16:19 CET; 1s ago
   Main PID: 1481918 (nginx-prometheu)
      Tasks: 8 (limit: 18994)
     Memory: 1.9M
     CGroup: /system.slice/nginx-prometheus-exporter.service
             └─1481918 /usr/local/bin/nginx-prometheus-exporter -nginx.scrape-uri http://127.0.0.1:10080/

Feb 19 21:16:19 valhalla systemd[1]: Started nginx-prometheus-exporter.
Feb 19 21:16:19 valhalla nginx-prometheus-exporter[1481918]: 2021/02/19 21:16:19 Starting NGINX Prometheus Exporter Version=0.8.0 GitCommit=de15093
Feb 19 21:16:19 valhalla nginx-prometheus-exporter[1481918]: 2021/02/19 21:16:19 Listening on :9113
Feb 19 21:16:19 valhalla nginx-prometheus-exporter[1481918]: 2021/02/19 21:16:19 NGINX Prometheus Exporter has successfully started
Exploring Nginx Prometheus Exporter Metrics
We can see Nginx Prometheus Exporter’s gathered metrics from its interface.
curl http://localhost:9113/metrics
A list of metrics and their current value will be listed.
# HELP nginx_connections_accepted Accepted client connections
# TYPE nginx_connections_accepted counter
nginx_connections_accepted 6
# HELP nginx_connections_active Active client connections
# TYPE nginx_connections_active gauge
nginx_connections_active 1
# HELP nginx_connections_handled Handled client connections
# TYPE nginx_connections_handled counter
nginx_connections_handled 6
# HELP nginx_connections_reading Connections where NGINX is reading the request header
# TYPE nginx_connections_reading gauge
nginx_connections_reading 0
# HELP nginx_connections_waiting Idle client connections
# TYPE nginx_connections_waiting gauge
nginx_connections_waiting 0
# HELP nginx_connections_writing Connections where NGINX is writing the response back to the client
# TYPE nginx_connections_writing gauge
nginx_connections_writing 1
# HELP nginx_http_requests_total Total http requests
# TYPE nginx_http_requests_total counter
nginx_http_requests_total 8
# HELP nginx_up Status of the last metric scrape
# TYPE nginx_up gauge
nginx_up 1
# HELP nginxexporter_build_info Exporter build information
# TYPE nginxexporter_build_info gauge
nginxexporter_build_info{gitCommit="de15093",version="0.8.0"} 1
Configuring Prometheus
Paste the following configuration into /etc/prometheus/prometheus.yml with your favorite editor. Replace “<YOUR METRIC TOKEN>” with your token.
global:
  scrape_interval:     15s # Set the scrape interval to every 15 seconds. Default is every 1 minute.
  evaluation_interval: 15s # Evaluate rules every 15 seconds. The default is every 1 minute.
  # scrape_timeout is set to the global default (10s).

  # Attach these labels to any time series or alerts when communicating with
  # external systems (federation, remote storage, Alertmanager).
  external_labels:
      monitor: 'prometheus-nginx'

# Alertmanager configuration
alerting:
  alertmanagers:
  - static_configs:
    - targets: ['localhost:9093']

# Load rules once and periodically evaluate them according to the global 'evaluation_interval'.
rule_files:
  # - "first_rules.yml"
  # - "second_rules.yml"

# A scrape configuration containing exactly one endpoint to scrape:
# Here it's Prometheus itself.
scrape_configs:
  # The job name is added as a label `job=<job_name>` to any timeseries scraped from this config.
  - job_name: 'prometheus'

    # Override the global default and scrape targets from this job every 5 seconds.
    scrape_interval: 5s
    scrape_timeout: 5s

    # metrics_path defaults to '/metrics'
    # scheme defaults to 'http'.

    static_configs:
      - targets: ['localhost:9090']

  - job_name: node
    # If prometheus-node-exporter is installed, grab stats about the local
    # machine by default.
    static_configs:
      - targets: ['localhost:9100']

  - job_name: nginx
    static_configs:
      - targets: ['localhost:9113']

remote_write:
 - url: https://listener.logz.io:8053
   bearer_token: <YOUR METRIC TOKEN>
   remote_timeout: 30s
   queue_config:
     batch_send_deadline: 5s
     max_shards: 10
     min_shards: 1
     max_samples_per_send: 500
     capacity: 10000
The configuration defines three scrape configs, Prometheus’s own metrics, node metrics, and Nginx metrics. The final part of the configuration enables the remote_write functionality, which passes along the metrics to another Prometheus server.
Visualizing Metrics with Logz.io
Logz.io visualizes logs with Kibana and provides for metrics visualization based on popular tooling. Some metrics are scraped from log files; most of these will be available via the Kibana interface. The rest of the metrics will be received by Logz.io Prometheus as a Service instance.
Let’s first look at the Prometheus metrics:
We can see all the metrics available in the query editor after we type Nginx on the query editor in the metrics UI’s Edit Panel page.
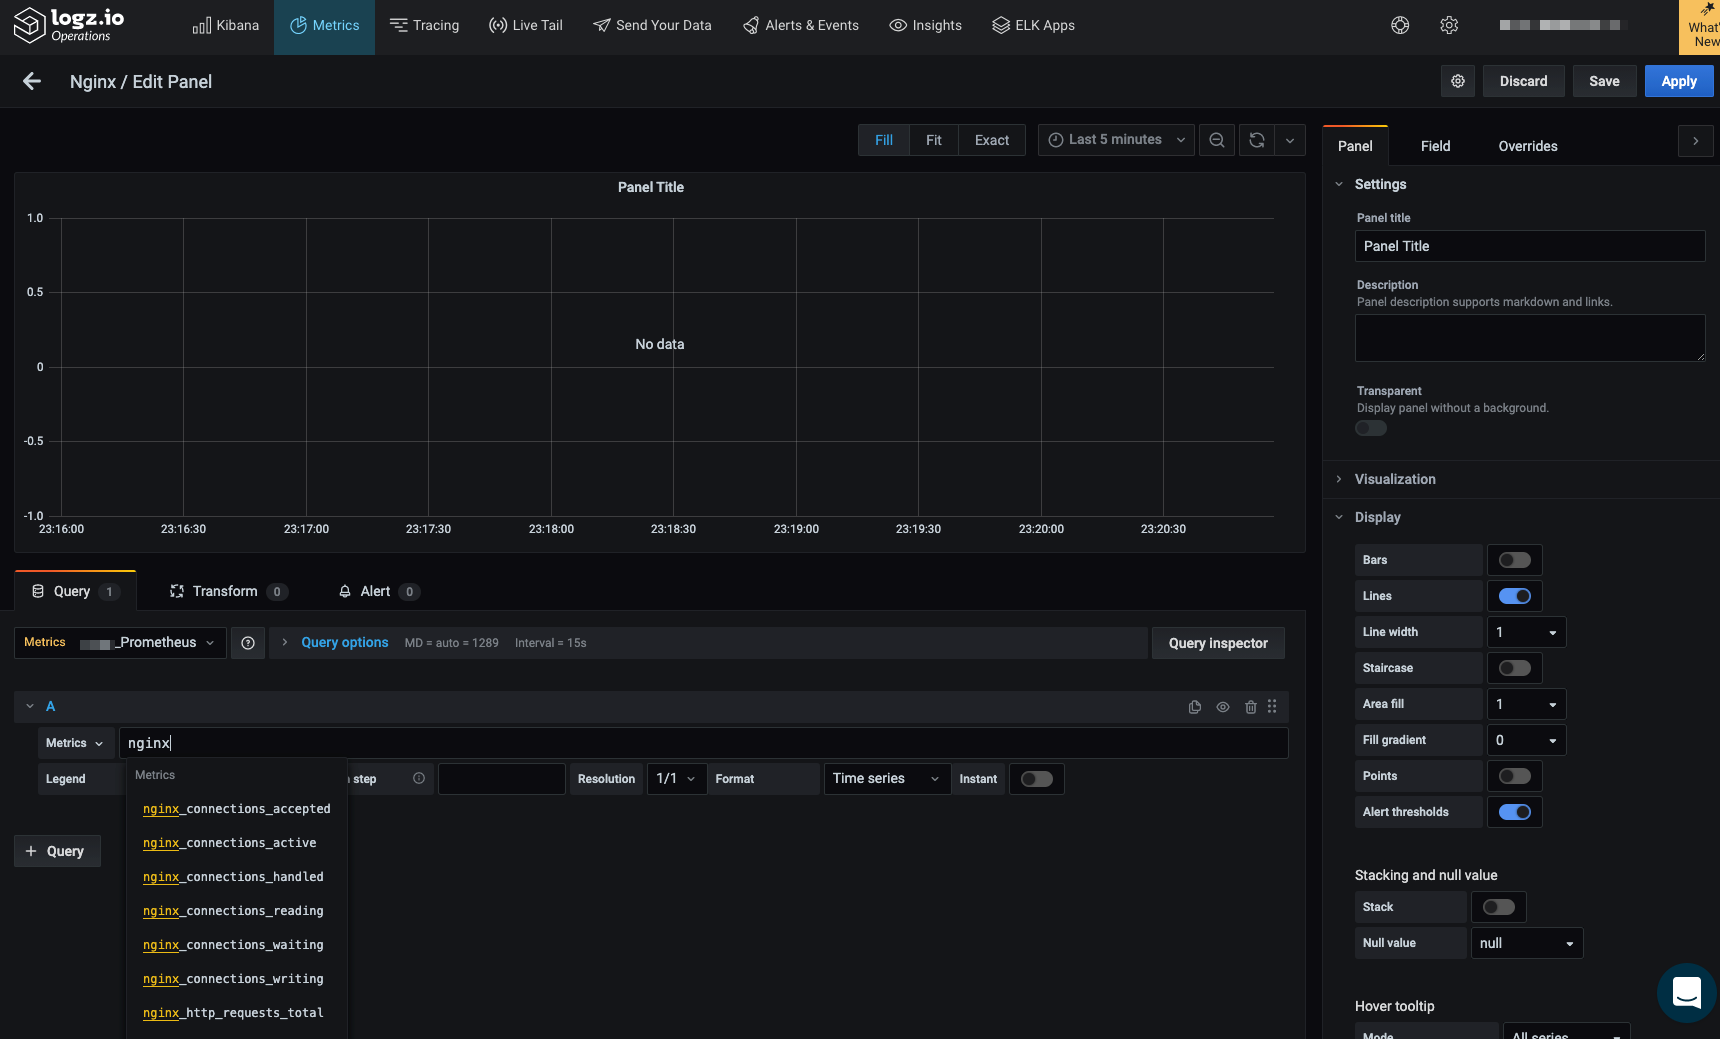
We can easily create a dashboard for our Nginx metrics.

Now it is time to view the metrics we got from the logs files, which we can view via Kibana.
We will use the “ELK Apps” feature, which includes pre-made dashboards for visualizations.
First, go to the “ELK Apps” section and search for Nginx; select the same apps you see below. Then move to Kibana and Visualize section to see what is available.

Average bytes of a request can be seen on the “Nginx average bytes” visualization.

In the “Nginx HTTP Codes” visualization, you can see the list of HTTP status codes that your web service returned to.

You can easily see a breakdown of your users’ operating system in the “Nignx Access By OS” visualization.

Use the “Nginx Access By Browser” visualization to see how your site is used on different browsers.

Viewing Logs with Logz.io
Live Tail is a tool that gives you the ability to observe logs in realtime. Just press the Play button to start live tailing.

Insights
The insights section is a feature backed by machine learning. It analyzes your logs and highlights interesting occurrences. Here we can see that there were failed attempts to login as root.

Conclusion
We have seen how to ship logs and metrics into Logz.io and used Prometheus as a Service product for our metrics. We also can easily view the logs arriving via the Live Tail function and, of course, searching via a powerful Kibana interface.
We have explored different visualization both in Kibana and the Logz.io metrics UI. Last but not least, the Insights feature allowed us to see some critical logs. There is also an alerts section, which we haven’t covered here.

You Might Also Like

Streamlining Observability: The Journey Towards Query Language Standardization

Getting Started with OpenTelemetry
Get started for free
Completely free for 14 days, no strings attached.
