
New Logz.io Platform Feature: The Home Dashboard
May 8, 2023

Managing observability data can feel like a juggling act. Modern cloud applications generate vast amounts of data, and quickly accessing the most important data is a fundamental step toward quickly gaining unobstructed visibility into your infrastructure and applications.
Yet, when data volumes grow, complexity follows. Many observability users find it overwhelming to assess the critical data generated from their complex infrastructure and applications. Who wants to spend valuable time trying to make sense of their telemetry data during a production incident?
Finding ways to sift through the data is essential for effective monitoring. Getting the full picture in the fastest way possible is critical for maximizing the overall value received from your data.
Introducing the Logz.io Home Dashboard
Logz.io strives to enable users to gain a comprehensive overview of their infrastructure in the least amount of time possible. That’s why we’ve created our brand-new Home Dashboard tab within our Open 360™ platform, giving users an immediate overview of their telemetry data volume, as well as the most critical information coming from it. Check it out below:

Previously, users entering our platform would be taken directly to our log management product, where they could see their log data. However, we wanted to create a user experience allowing users to get an overview of their data — across logs, metrics, and traces — as soon as they enter the platform.
With the Home Dashboard, the first thing you’ll see when opening Logz.io is a full overview of your observability environment. All of your ingested log, metric, and trace data, as well as their associated alerts, insights, and exceptions, will appear within the Home Dashboard and can be adjusted based on the desired timeframe.
Below this, you’ll notice a table composed of events such as alerts, insights, and exceptions. These events are categorized and can be filtered by fields such as the timeframe, event type, count, and severity level, making it easy to gain quick contextual information from them and act accordingly:
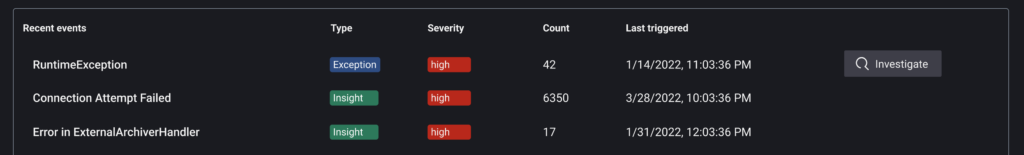
Next to each of these events is the option to further investigate the event, which will automatically bring you to the relevant associated logs. This allows you to seamlessly explore your data based on the information within the dashboard.
The Home Dashboard also offers easy access to your logs and metrics dashboards, allowing you to search any available dashboard across your account. You’re able to see recently accessed dashboards, or quickly favorite your highly-used ones for quick access.
With the Home Dashboard, you’re able to gain key insights immediately upon entering the product. Surveying your telemetry data is now faster and easier than ever before.
Try Out the Logz.io Home Dashboard Today
Comprehending your data doesn’t have to be complicated. At Logz.io, we’re continuing to build features within our platform that continuously improve the troubleshooting process for our users.
If you’d like to check out the new Home Dashboard or see our other platform features, sign up for a free trial today.

You Might Also Like

Tool Consolidation Is Dead. Long Live Agentic AI.

