
Kafka vs. Redis: Log Aggregation Capabilities and Performance
November 23, 2016
Today, it’s no question that we generate more logs than we ever have before. However, due to the large amount data that is constantly analyzing and resolving various issues, the process is becoming less and less straightforward.
Essentially, log management helps to integrate all logs for analysis. An important preliminary phase is log aggregation, which is the act of collecting events logs from different systems and data sources. It includes the flow and tools necessary to gather all data into one single secure data repository. The log repository is then analyzed to generate and present the metrics and insights needed for the operations team.
Today, the most popular tools for log aggregation are Kafka and Redis. Both tools provide the functionality of data streaming and aggregation in their own respective ways. In this post, we are going to compare the two in regards to their various capabilities and performance tests.
Capabilities
About Kafka
Kafka is a distributed, partitioned and replicated commit log service that provides a messaging functionality as well as a unique design. We can use this functionality for the log aggregation process.
The basic messaging terms that Kafka uses are:
- Topic: These are the categories in which messages are published.
- Producer: This is the process of publishing messages into Kafka’s topics.
- Consumer: This process subscribes to topics and processes the messages. Consumers are part of a consumer group which is composed of many consumer instances for scalability and fault tolerance.
- Broker: Each server in a Kafka cluster is called a broker.
The logs fetched from different sources can be fed into the various Kafka topics through several producer processes, which then get consumed by the consumer.
Kafka provides various ways to push data into the topics:
- From command-line client: Kafka has a command-line client for taking input from a particular file or standard input and pushing them as messages into the Kafka cluster.
- Using Kafka Connect: Kafka provides a tool that implements custom logic using connectors to import/export data to the cluster.
- By writing custom integration code: The final way is to write the code for integrating data sources with Kafka using the Java producer API.
In Kafka, each topic has log data partitions that are managed by the server:
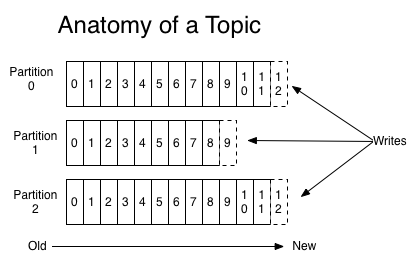
(Source: Kafka documentation)
Kafka distributes the partitioned logs among several servers in a distributed system. Each partition is replicated across a number of servers for fault tolerance. Due to this partitioned system, Kafka provides parallelism in processing. More than one consumer from a consumer group can retrieve data simultaneously, in the same order that messages are stored.
In addition, Kafka allows the use of as many servers as needed. It uses a disk for its storage, therefore, might slow to load. However, due to the disk storage capacity, it can store a large amount of data (i.e., in terabytes) for a longer retention period.
About Redis
Redis is a bit different from Kafka in terms of its storage and various functionalities. At its core, Redis is an in-memory data store that can be used as a high-performance database, a cache, and a message broker. It is perfect for real-time data processing.
The various data structures supported by Redis are strings, hashes, lists, sets, and sorted sets. Redis also has various clients written in several languages which can be used to write custom programs for the insertion and retrieval of data. The main similarity between the two is that they both provide a messaging service. But for the purpose of log aggregation, we can use Redis’ various data structures to do it more efficiently.
In a previous post, we described in detail how Redis can support a production ELK (Elasticsearch, Logstash, Kibana) Stack. In this example, we explained how Redis can serve as an entry point for all logs. It’s used as a messaging service and buffers all data. Only when the Logstash and the Elasticsearch have the resources required does Redis release the aggregated log data, ensuring no data leaks due to lack of resources.
Performance
When both Redis and Kafka performances were tested, the results were very interesting.
Kafka
Kafka’s popular messaging queue system is tested a lot by major companies such as Linkedin, which in fact, its engineers actually wrote the first version of Kafka. In their tests, LinkedIn used Kafka in cluster mode with six machines, each with an Intel Xeon 2.5 GHz processor with six cores, 32 GB of RAM, and six 7200 RPM SATA drives.
Producers
For the first test, one topic was created with six partitions and without replication. There were 50 million records generated in a single thread using a single producer. Each message size was 100 byte.The peak throughput generated using this setup was a bit over 800K records/sec or 78 MB/sec. In a different test, they used the same base setting with three producers running on three separate machines. In this case, we see that the peak is much higher at around 2,000records/sec or 193.0 MB/sec.
Asynchronous vs. Synchronous Replication
The second batch of tests dealt with the replication method. Using the same number of records and message size and a single producer similar to the previous test, there were three replicas. The replication worked in an asynchronous fashion and its throughput peak was around 766K records/sec or 75 MB/sec.
More on the subject:
However, when the replication was synchronous – which means that the master waits for an acknowledgment from the replicas – the throughput peak was low at around 420K records/sec or 40 MB/sec. Though this is a reliable setup since it ensures all messages arrive, it results in significantly lower throughput because the time it takes for the master to acknowledge the reception of the messages.
Consumers
In this case, they used the exact same number of messages and size as well as 6 partitions and 3 replicas. They applied the same approach by increasing the number of consumers. In the first test with a single consumer, the highest throughput was 940K records/sec or 89 MB/sec. However, not surprising, when three consumers were used, the throughput reached 2,615K records/sec processed or 249.5 MB/sec.
Kafka’s throughput performance is based on the combination of the amount of producers, the consumer, and the replication method. For this purpose, one of the tests included was a single producer, a single consumer and three replicas in an async mode. The peaks achieved in this test were 795K records/sec processed or 75.8 MB/sec.
Messages Processing Throughputs
As shown below, we can expect a decrease in records per second as the record size increases:
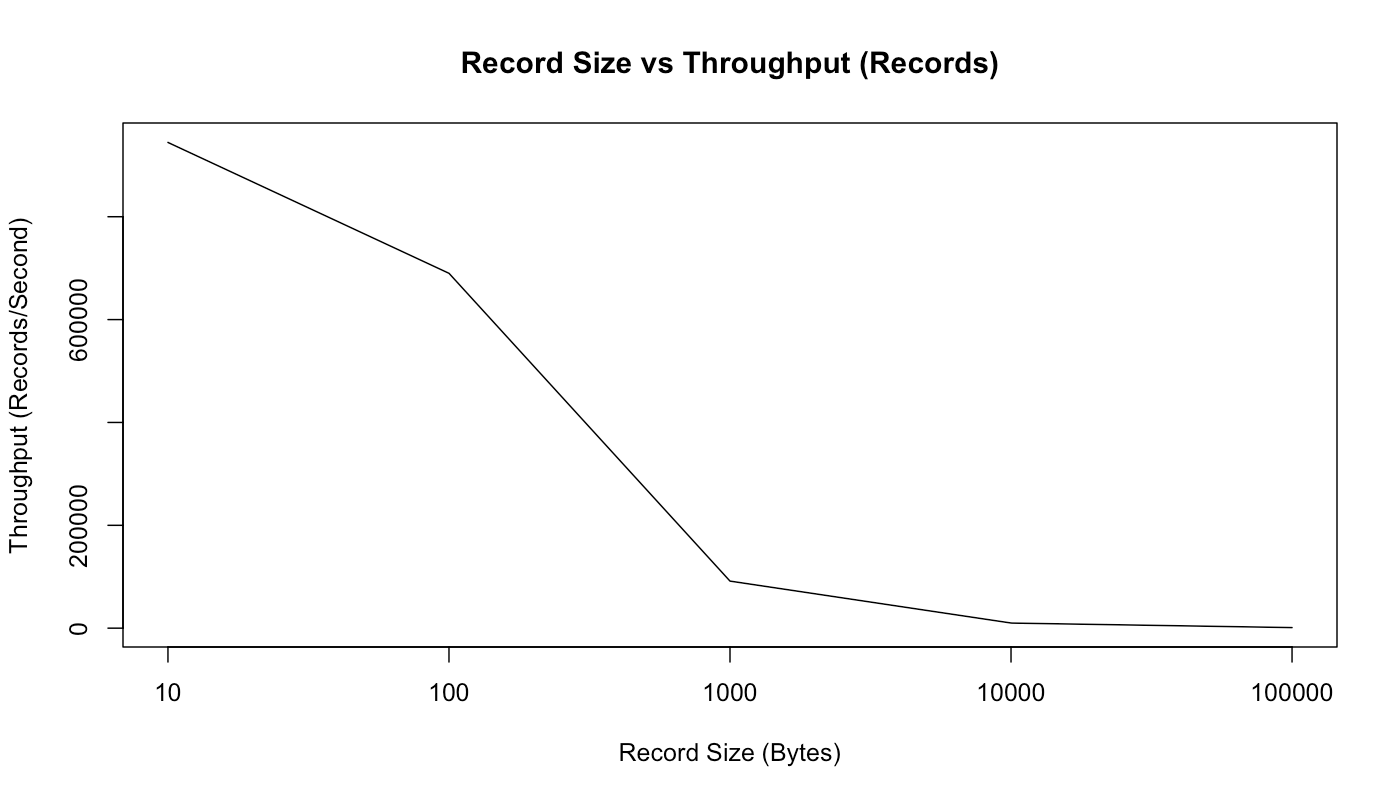
Message Size vs. Throughput (rec/sec) (source)
However, as we can see in the graph below, as the record size in bytes grows, so does the throughput. Smaller messages create a low throughput. This is due to an overhead of queuing the messages which impacts the machine performance:
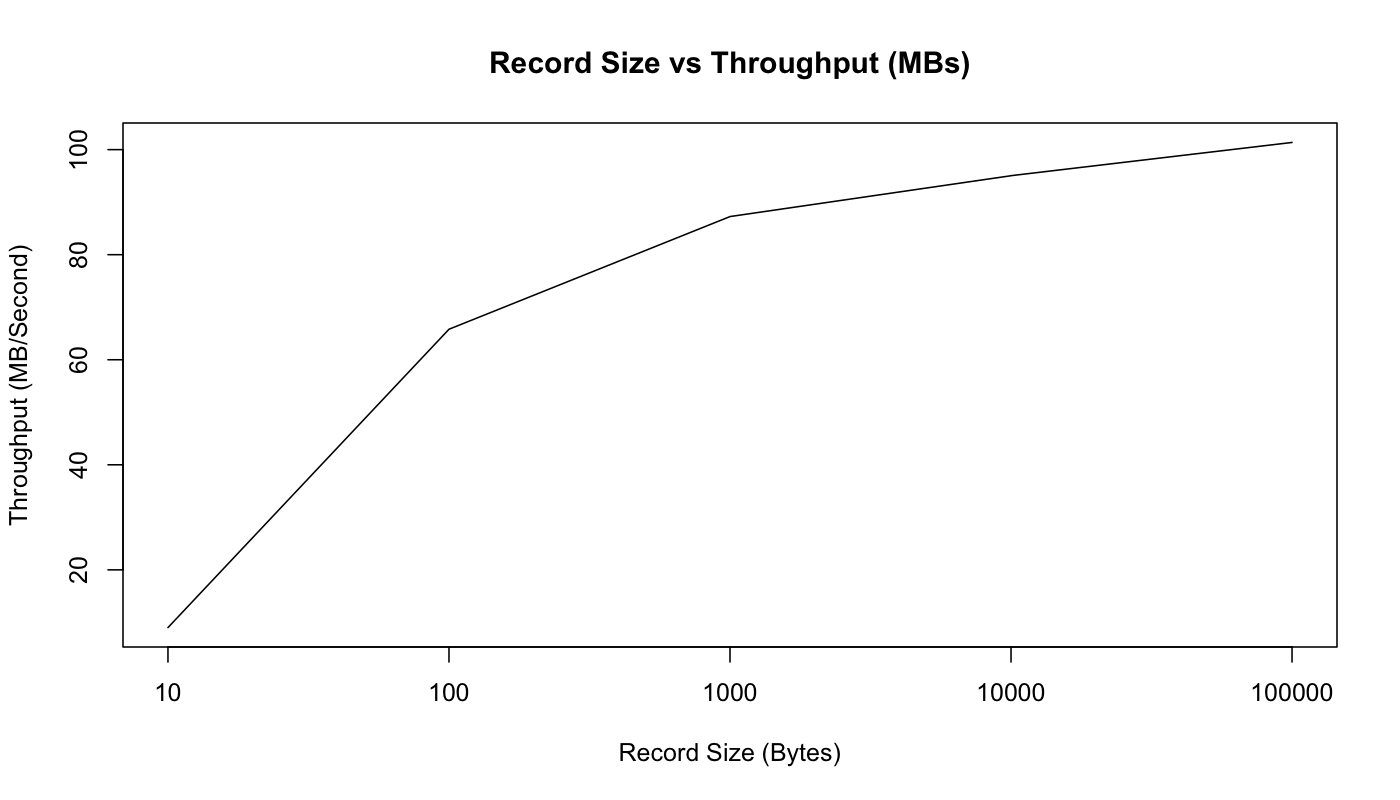
Message Size vs. Throughput (MB/sec) (source)
In addition, as we can see in the graph below, the amount of consumed data isn’t impacting the performance of Kafka.
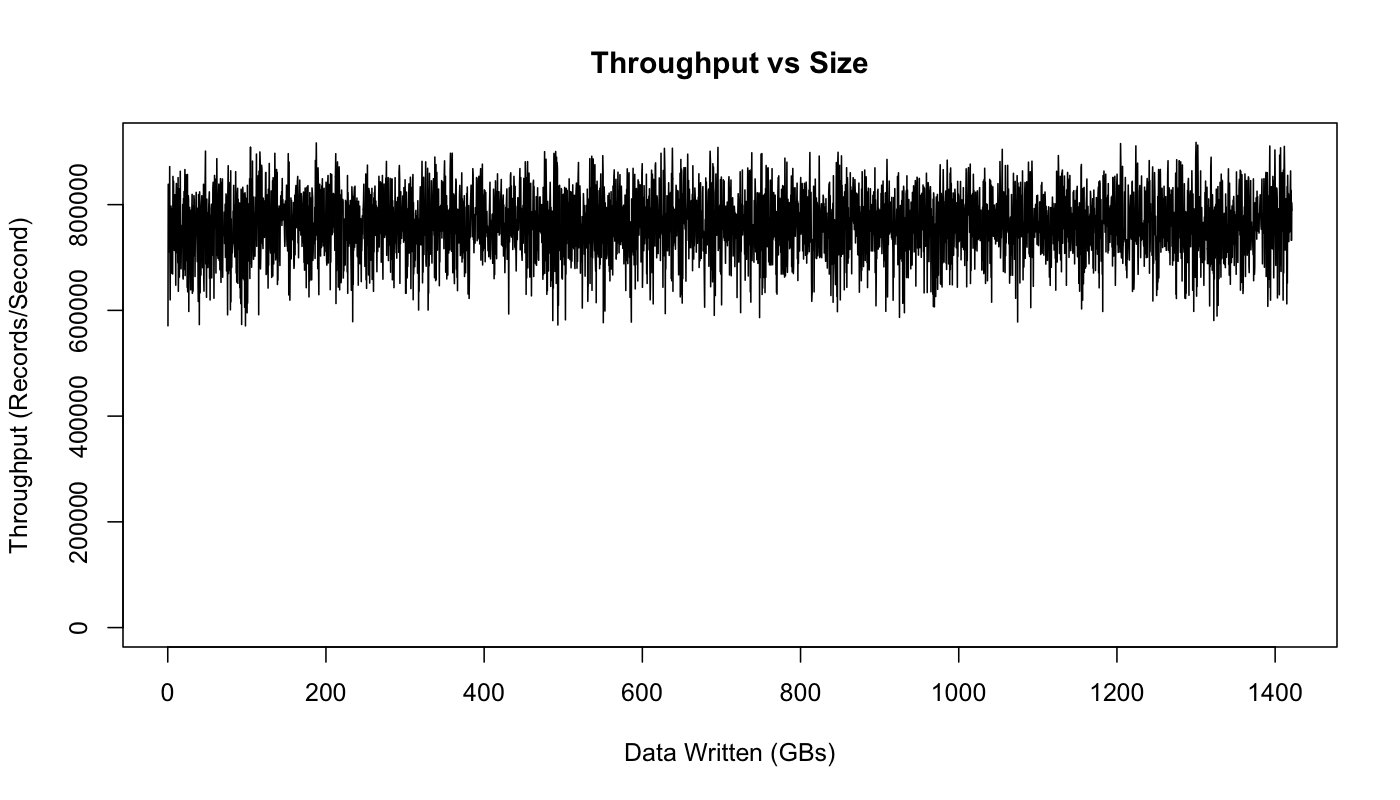
Throughput vs. Size (source)
Kafka heavily relies on the machine memory (RAM). As we see in the previous graph, utilizing the memory and storage is an optimal way to maintain a steady throughput. Its performance depends on the data consumption rate. In the case that consumers don’t consume data fast enough, Kafka will have to read from a disk and not from memory which will slow down its performance.
Redis Throughput
Let’s examine Redis’ performance when it comes to message processing rates. We used the very basic Redis commands that will help us measure its performance: SET, GET, LPUSH, and LPOP. These are common Redis commands used to store and retrieve Redis values and lists.
In this test, we generated 2M requests. The key length was set between 0 and 999999 with a single value size of 100 bytes. The Redis was tested using the Redis benchmark command.
Redis Pipelining
As shown below, in our first test we observed significant differences in performance improvement when using Redis pipelining. The reason is that, with a pipeline, we can send multiple requests to the server without waiting for the replies and finally check the replies in a single step.
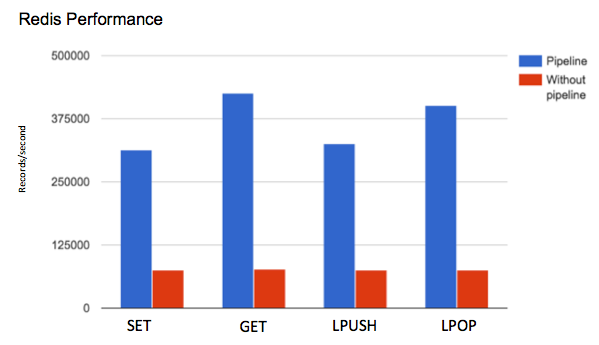
Throughput vs. command with or without Redis pipeline (2.6 GHz Intel Core i5, 8GB RAM)
The data size on Redis can vary. As you can see, the graph below shows throughput with different value (message) sizes. In the graphs, it’s easy to see that when the message size is increased, the throughput, in terms of the number of requests per second, decreases. As shown below, this behavior is consistent with all four commands.
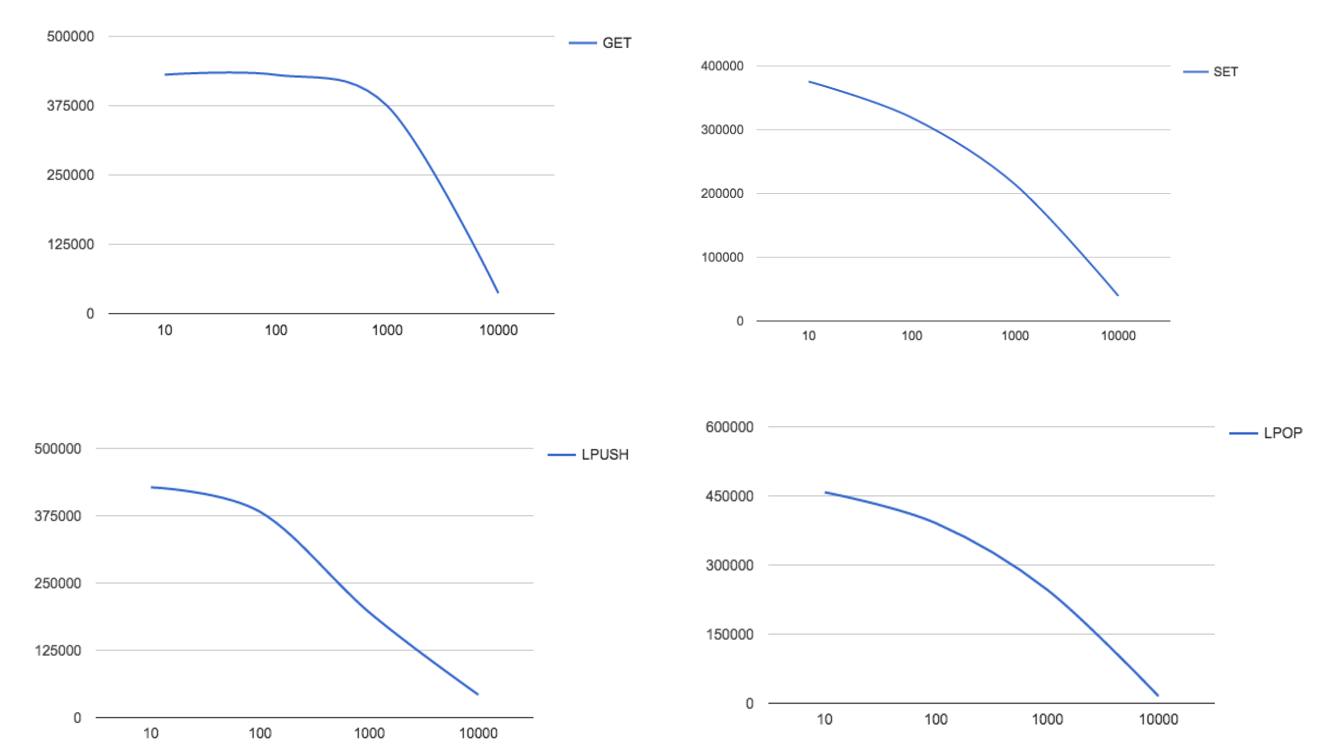
Throughput vs. different message size (bytes)
In addition, as shown below, we measured the written data in bytes. We saw that the number of written bytes in Redis grew as we increased the number of records, which is somehow intuitive and something identical that we noticed in Kafka.
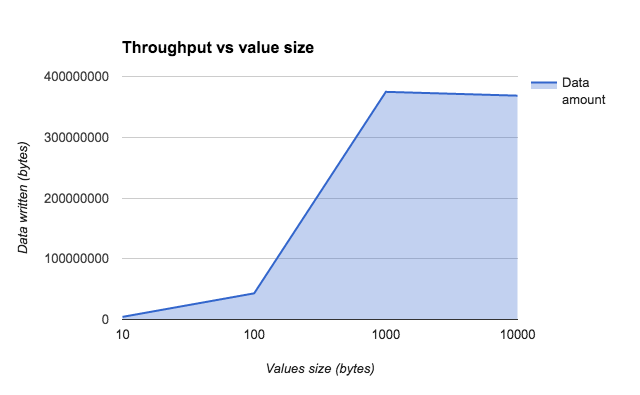
Throughput vs. value size for GET commands
Redis snapshotting supports the Redis persistence mode. It produces point-in-time snapshots according to user’s preference, including, for example, the time passed from the last snapshot or number of writes. However, if for example a Redis instance restarts or crashes, all data between consecutive snapshots will be lost. Redis persistence doesn’t support the durability in such cases and is limited to applications in which recent data is not important.
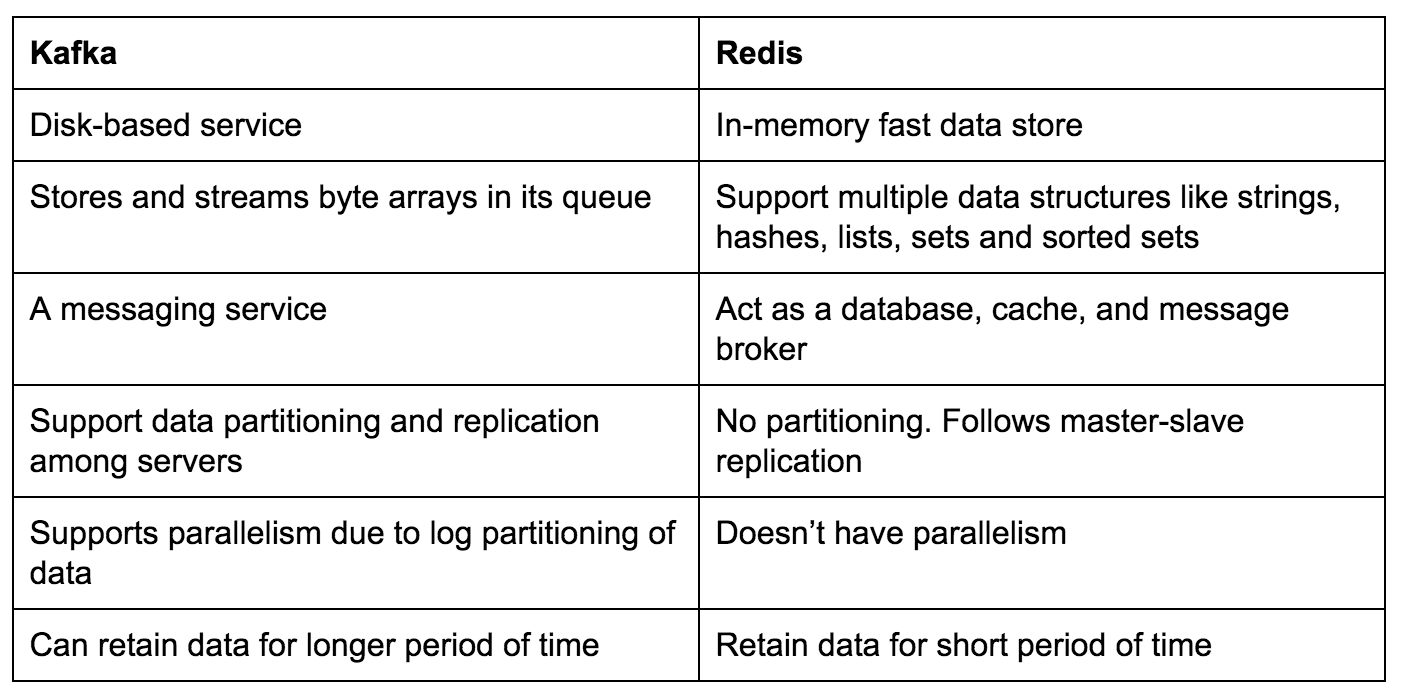
Kafka vs. Redis: A Summary
As mentioned above, Redis is an in-memory store. This means that it uses its primary memory for storage and processing which makes it much faster than the disk-based Kafka. The only problem with Redis’ in-memory store is that we can’t store large amounts of data for long periods of time.
Since the primary in-memory is smaller than a disk, we have to clear it regularly by automatically moving data from in-memory to disks and making room for new data. Redis is persistent by allowing us to dump the dataset into a disk if necessary. Redis also follows the master-slave architecture, and replication is only useful when persistence is turned on in the master.
In addition, Redis doesn’t have the concept of parallelism like Kafka does, where multiple processes can consume the data at the same time.
Based on both tools’ features and though the above tests for Kafka vs. Redis are not exactly the same, we still can summarize that when dealing with real-time messages processing with minimal latency, you should first try Redis. However, in case messages are large and data should be reused, you should first consider Kafka.
A Summary Table
The Next Step: Robust Log Data Shipment
As mentioned at the beginning of this post, using tools such as Kafka and Redis could be a great solution to protect Elasticsearch, which is very susceptible to load. But with simple architecture (see the picture below), using Fluentd — which is used for shipping data from Kafka or Redis to Elasticsearch — can protect the system from interrupting the data streams. In this case, the data will continue to flow even if your Elasticsearch cluster is down. Once it is restored, you can reconnect Fluentd and Elasticsearch and continue to index the messages queued in Kafka or Redis.
Another relevant scenario in need of a robust log aggregator is when you want to give more strength to your ELK stack and scale it up. For example, with multiple Kafka queues, you can dedicate as many Logstash instances as you want in order to fill Elasticsearch with data from the topics. This is useful when dealing with large Elasticsearch clusters that need to handle the indexing of large amounts of data.

Integration of Kafka and Fluentd for shipping logs into Elasticsearch
Integration with Fluentd
Kafka
When integrating Fluentd with Kafka for the purposes of putting in or extracting data from a topic, we can write a custom Java application using a Kafka consumer API.
We have used the following Java application for doing the same: https://github.com/treasure-data/kafka-fluentd-consumer
The modification is needed in config/fluentd-consumer.properties with an appropriate configuration. Update the Fluentd configuration as follows:
<source>
  type forward
</source>


<source>
  type exec
  command java -Dlog4j.configuration=file:///path/to/log4j.properties -jar /path/to/kafka-fluentd-consumer-0.2.3-all.jar /path/to/config/fluentd-consumer.properties
  tag dummy
  format json
</source>
Redis
- For integrating Redis with Fluentd, we can write a plugin in any clients that are supported by the Redis (for various programming languages).
- We have used the following input plugin for Fluentd written in Ruby: https://github.com/onurbaran/fluent-plugin-redislistener
- This plugin extracts data from the list data structure and puts it into Fluentd.
- For using this plugin, you have to install a Ruby client (we used redis-rb) supported by Redis.
- You can find the Redis-rb client here: https://github.com/redis/redis-rb
Integrating with Logz.io
Both Kafka and Redis can be integrated in the same manner with the Logz.io ELK Stack. All you have to do is use the Fluentd Logz.io plugin using the following command:
gem install fluent-plugin-logzio
After installing the output plugin, update your Fluentd configuration. As you can see in the example below, in one single cluster, you can define as many topics as you want. The final Fluentd configuration should look like the example below:
<source>
  type forward
</source>


<source>
  type exec
  command java -Dlog4j.configuration=file:///path/to/log4j.properties -jar /path/to/kafka-fluentd-consumer-0.2.3-all.jar /path/to/config/fluentd-consumer.properties
  tag dummy
  format json
</source>


<match your_match>
      type logzio_buffered
      endpoint_url https://listener.logz.io:8071?token=<TOKEN>&type=my_type
      output_include_time true
      output_include_tags true
      buffer_type    file
      buffer_path    /path/to/buffer/file
      flush_interval 10s
      buffer_chunk_limit 1m   # Logz.io has bulk limit of 10M. We recommend set this to 1M, to avoid oversized bulks
</match>
Where token value which can be found inside User settings page on Logz.io as shown below, and your_match can be *.** to match all events:
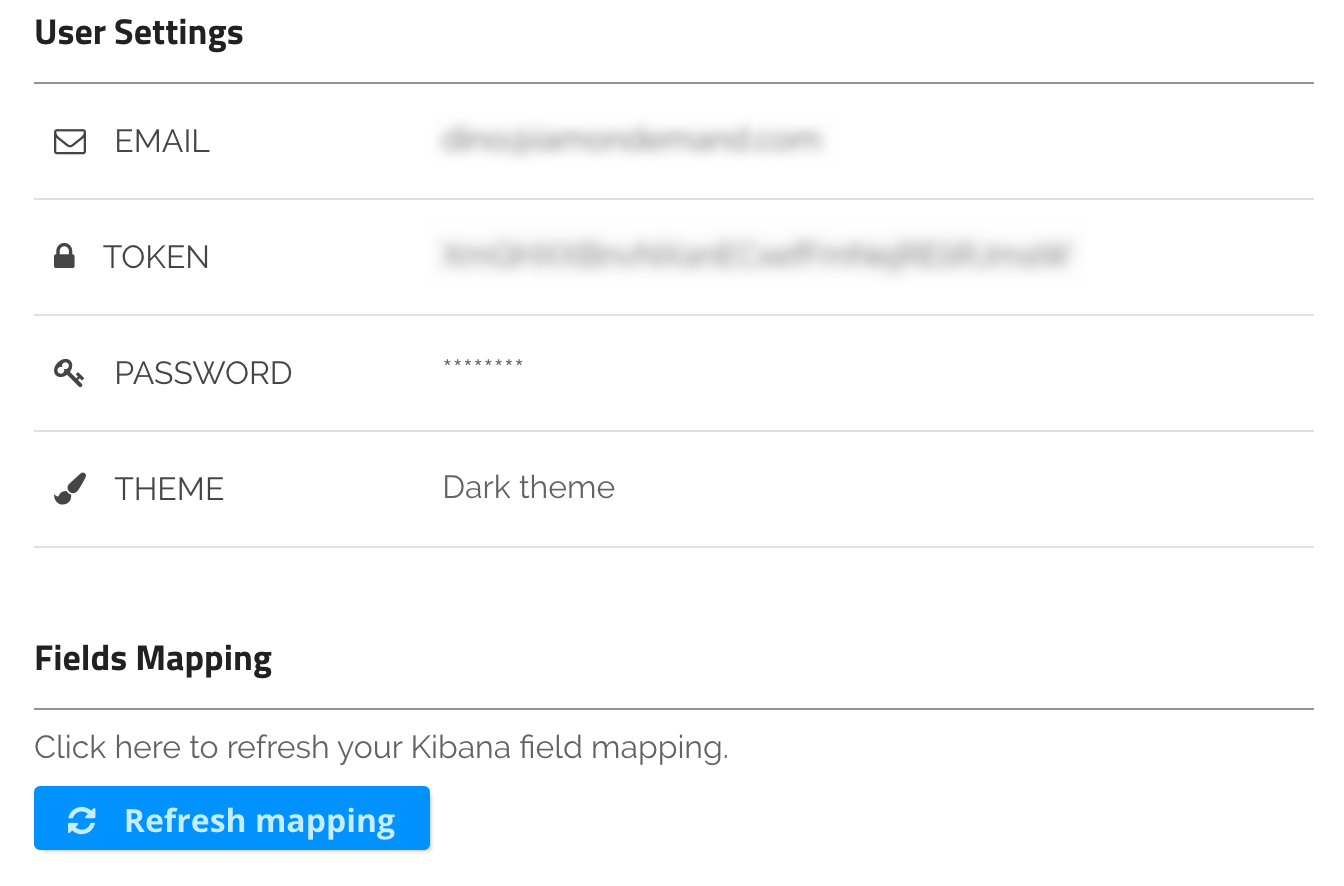
Logz.io user settings
A Final Note
This article explains the benefits of using queues or in-memory stores like Kafka and Redis for the purpose of log aggregation. These two are beasts in their category, but as described they operate quite differently. Redis’ in-memory database is an almost perfect fit for use-cases where short-lived messages and persistence aren’t required. On the other hand, Kafka is a high throughput distributed queue which is built for storing a large amount of data for longer periods of time.

You Might Also Like
Log Aggregation

