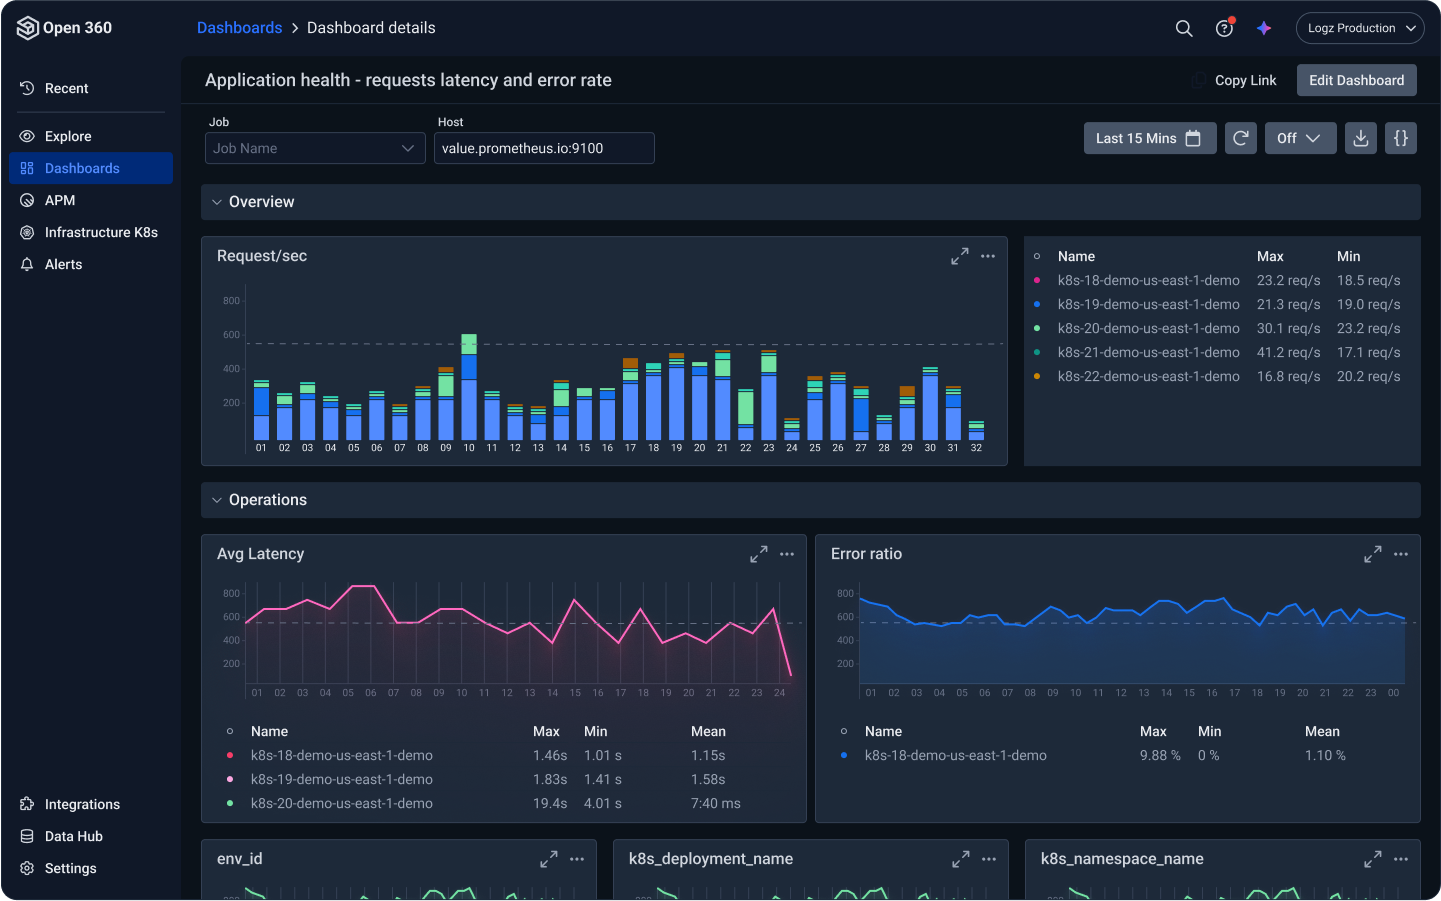
Get Started with the Public Beta for Unified Dashboards
December 14, 2021

During Logz.io’s ScaleUp 2021 user conference, we announced that Unified Dashboards were coming to you soon. And now it’s finally here for anyone to try during the Public Beta.
Unified Dashboards will allow Logz.io customers to analyze and filter their logs, metrics, and traces side-by-side on a single monitoring dashboard.
Check out our recent blog to learn about why we built Unified Dashboards and the value they bring to customers. Below, let’s go through the steps needed to set up a Unified Dashboard and begin filtering and investigating the data.
How to Build Unified Dashboards
If you haven’t already, make sure to open up a Logz.io Infrastructure Monitoring account by simply navigating to the ‘Metrics’ tab in the Logz.io platform and following the directions from there. All Unified Dashboards are created through the Infrastructure Monitoring product (for now).
Once you’ve sent log, metric, and/or trace data to Logz.io , hover over the ‘+’ button in the left toolbar of the Infrastructure Monitoring product page and hit the ‘Create’ button.
Choose the ‘Add an empty panel’ option to create your first data visualization.
First, give your visualization a title (‘A’ in the screenshot below). We’ll be creating a visualization that monitors CPU across our pods.
Then, choose the data source that contains the data you want to monitor – which you’ll find in the drop down menu in the ‘Data source button’ (B).
As you can see, there is a label that indicates whether the data source contains logs, metrics, or traces. These data sources represent the different data in your account. In this case, we chose the ‘Sock Shop Metrics Dev’ data source.
Now it’s time to build our query. In this case, we selected ‘Sock Shop metrics’ as our data source. We will use PromQL as the query language for this visualization since the metrics are being scraped by Prometheus and kept in M3DB – a Prometheus compatible database Logz.io uses to store metrics.
Once you type in your PromQL query, you’ll see the relevant data automatically populate.
For log and trace visualizations, you’ll use the Lucene query language (see our guide here) because the data is stored in Elasticsearch (soon to be Opensearch!!!).
There are a number of ways to customize your visualizations. Let’s build another visualization to monitor our logs for each service, which will look quite different.
Since we want to see all the logs for each service, we don’t need a lucene query to narrow the data. But we do want to break the logs up by service, so we will group them by ‘Terms’, which lets us group the data by fields in Elasticsearch. To give the visualization a time field, we’ll need to group the data again by hitting the plus sign next to the ‘Group by’ option and select ‘Date Histogram’ (A), which gives us this visualization.
To make it a bar chart, we can select the ‘Bars’ style under the “Graph styles” configurations on the right (B).
These are just a few of the many ways to change the data in your visualizations – contact Support through the chat (bottom right corner) if you have any questions during your visualization configurations.
Organize your visualizations to create a dashboard in Logz.io Infrastructure Monitoring. As you can see below, we have log and metric visualizations side-by-side – ready for analysis.
How to Filter Data in Unified Dashboards
Once you’ve built your visualizations, you’ll be able to narrow down all the data together to investigate it quickly with Unified Filters.
Start by hitting ‘Filters’ in the top right corner (A) and then hit ‘Add a filter’ (B).
In the drop down, you’ll see different variables to filter. Simply select the variable you’re interested in, choose an operator, and type in the relevant field. Below, we added a filter to narrow down our memory metrics, cpu metrics, and logs from the ‘front-end’ service together.
The Magic behind the Filters: Unified Variables
How did we get those variables in the first place? The log and metric data live in separate data stores (Elasticsearch and M3DB, respectively) and we never configured anything to unify the data under a single set of variables.
The answer is the machine learning behind Unified Variables – which are automatically created to give log, metric, and trace data one set of variables to filter the all data. Users can also manually create new variables or edit existing ones to expand the variables’ reach.
A big next step in our platform experience with the best open source
Logz.io uniquely brings together all your telemetry data with the best-of-breed open source technologies – consisting of Prometheus for metrics, the ELK Stack for logs, and Jaeger for traces. Unifying the data simplifies observability stacks and makes it possible to correlate information from different data.
Now with Unified Dashboards, Filter, and Variables, you can correlate that information faster.
Filtering the data on one dashboard makes it easy to connect the dots between different data types to immediately get the full picture of your environment.
Got any feedback? This is the time to provide it! Please let us know through the chat bot in the bottom right corner.


