
Finding the Bug in the Haystack: Hunting Down Exceptions in Production
March 24, 2021

This post is co-published by Ozcode and is co-authored by Omer Raviv, Co-founder & CTO @ Ozcode, and Dotan Horovits, Product Evangelist @ Logz.io.
Software companies are in a constant pursuit to optimize their delivery flow and increase release velocity. But as they get better at CI/CD in the spirit of “move fast and break things,” they are also being forced to have a very sobering conversation about “how do we fix all those things we’ve been breaking so fast?”
As a result, today’s cloud-native world is fraught with production errors, and in dire need of observability.
Climbing the ELK Stack Everest
The depth and breadth of production errors in today’s cloud-native world is apparent from the vast number of exceptions that these applications generate. And how do companies address the issue?
Logs, logs, and more logs.
Modern applications generate mountains of logs, and those logs are generously peppered with exceptions. The sheer magnitude of exceptions makes it extremely difficult to weed out just the right ones. Which exceptions are new? Which are just noise? Which contain important information, such as an error in a newly deployed feature, or a customer that’s having a terrible experience and is about to churn?
Let Machine Learning Find the needle in a Haystack of Errors in Kibana with Logz.io
Let’s take a look at a real-world scenario. If you’ve ever worked at an eCommerce company, this will sound familiar.
The end of November rolls around.
Your friends and family are giddy about all the neat things they’re going to buy.
You are somewhere between stressed and having a full-blown panic attack. It’s your company’s biggest day of the year for sales. Your infrastructure and code had better be up for the task.
Black Friday hits, your website traffic is peaking, and the nightmare begins.
Despite all of your best efforts and meticulous testing, your “buy 2 get 1 free” coupon code simply DOES NOT WORK.
What now?
Let’s look at some logs.

I already mentioned that your logs are likely to contain loads of exceptions. How are you going to pick out the ones related to your coupon code? The ELK Stack is popular for ingesting those mountains of logs and slicing and dicing them in Kibana Discover to understand the scenario at hand. Each log entry can contain structured data, so you can filter on a specific field or piece of contextual data. Logs can also be enriched with additional contextual data you can filter on such as a user’s email, the browser type etc.
In our Black Friday nightmare scenario, you might filter on the particular services that are flaking out, the relevant time frame, and on your coupon code field:

A typical investigation in Kibana Discover involves an iterative process of filtering and querying to narrow down the search context, which can be tedious and time-consuming when having so many outstanding exceptions in the environment.
Logz.io offers a Log Management service based on the ELK Stack that saves you the hassle of managing the open source yourself at scale. But it does much more than that. Logz.io’s Exceptions tab within Kibana Discover does a fantastic job doing what no human can – looking through the hundreds of thousands of log lines that contains exceptions and using machine learning smarts (Logz.io’s Insights Engine) to group them together to a concise aggregated view, which can be filtered in all the same useful ways we apply filters in Kibana Discover.
In our Black Friday incident, even after filtering out we’re faced with more than half a million log hits. However, the Logz.io’s Exceptions tab in Kibana flags only 17 clustered exceptions in this search context. Let’s take a closer look at these errors:

In the Exceptions tab we immediately spot a new exception – ArgumentOutOfRangeException – that started firing intensively during the incident time window. In a real-world, cloud-native system, this would filter out the noise and let you home in on the right exceptions.
You now know where to start your final assault, where to start looking. But where do you go from here?
Ozcode – see the code behind the logs
The logs are the telemetry of our software’s black box. It records what the system tells us it is doing. Now that we used Logz.io’s Insights Engine to find out which exception we should focus on, we’d like to open up the black box and get code level understanding of that exception. This is where Ozcode’s exception capture comes in. Ozcode Production Debugger’s exception capture includes all the data we need: you can time travel to see line-by-line code execution, up to the point where your application threw an exception, viewing locals variables, method parameters and return values, network requests, database queries and more.
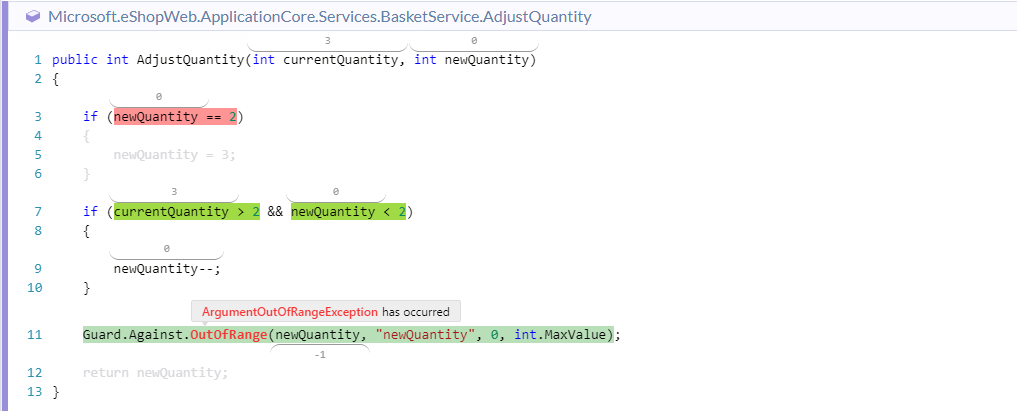
The ArgumentOutOfRangeException exception and call stack we saw in Logz.io’s Kibana view doesn’t tell us much to help us understand what happened. However, by simply jumping over to the Ozcode dashboard and filtering for the specific exception type and time range, we can delve deeper…

The Ozcode recording shows us a visual look at the code execution that led to the bug – every expression that was false is highlighted in red, every expression that was true is highlighted in green, and every variable and method call show their exact value. We can see we had a simple calculation error in our “Buy 2 Get 1 free” sale, which made us think the customer wanted to buy a negative number of items.
Now that we understand what happened, That’s an easy fix! No need to try to solve the mystery and try to reproduce the issue on the local dev machine.
Zoom in fast and fix things
The ELK stack, in Kibana in particular, gives us tremendously powerful tools to investigate logs. Using Logz.io’s machine learning-based insights, we can surface the relevant exceptions and related logs inside Kibana out of the endless noise and millions of logs that modern cloud-based systems generate.
The Ozcode Production Debugger enhances this experience even further, by giving us code-level-observability and time travel recording to quickly understand the root cause behind each exception. You can combine that with additional telemetry such as metrics and traces to increase your system’s observability and enhance your troubleshooting capabilities.

You Might Also Like

Jaeger Essentials: Distributed Tracing from Dapper to Jaeger

