
Going Smaller: Deploying ELK Stack to the Raspberry Pi
July 17, 2017

In the world of modern DevOps, the cloud is the solution most think of when it comes to monitoring logs, gathering system architecture information, and deploying applications. The cloud is the answer, and we need it fast, reliable, distributed, and accessible.
While this is true, the rise of IoT has increased the need for bare metal (or plastic and solder) solutions — and we strive to find them, sometimes just to indulge our geeky nature. There, though, are some reasons for monitoring our IoT solutions. As more devices “get smart” and more of our software integrates with these devices, we’ll need to monitor these devices and ensure we are getting the performance and information we need.
So, what if it wasn’t necessary to deploy to the cloud? What if, in fact, we wanted to go smaller? Take things not to the next level but to a level previous (or maybe three levels previous)?
I decided this would be interesting to explore, so it was time to grab my Raspberry Pi and see if we could make this happen.
The Specs
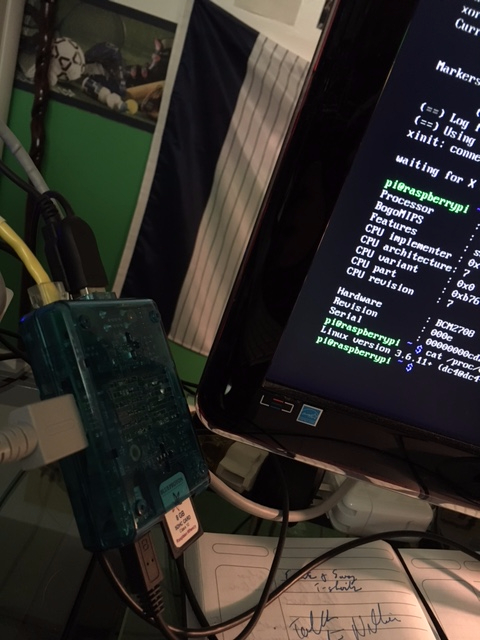
For this experiment, I’m using a Raspberry Pi Model B, PCB Revision 2.0. To obtain this information from your unit, run the following command:
$ cat /proc/cpuinfo
With this knowledge, you can use this handy guide to Raspberry Pi hardware history to understand what hardware you have.
More on the subject:
My Raspberry Pi is running on a 32 GB SD card with Raspbian Wheezy (a Debian variant) installed, version name Jessie, kernel version 4.4. It is possible to purchase these chips ready-made or to build them (if you have a machine with an SD card reader). While this comes with a preloaded GUI, we’ll be doing our initial installation work in the terminal that loads on startup.
Unlike our explorations into deploying the ELK Stack to the cloud, we don’t have to do any login screens or account setup — it’s just the Raspberry Pi — so let’s jump in.
Installing Java
Before beginning any Linux related installation, we start by ensuring all our packages are up to date:
$ sudo apt-get update
This will update all the packages on your system, ensuring that you have what you need. Once that is in place, it will be necessary to install Java as the runtime environment is necessary. To do this, run:
$ sudo apt-get install default-jre
Since the ELK Stack requires a Java version higher than 1.8, this command should put an installation that is sufficient for our needs.
Install Elasticsearch
We’ll now run a couple of commands to get and install Elasticsearch. This is the beginning of our stack. We may want to create a folder in which to install of these things, so we’ll do that first:
$ sudo mkdir /usr/share/elasticsearch
$ cd /usr/share/elasticsearch
$ wget https://packages.elastic.co/GPG-KEY-elasticsearch
$ sudo apt-get install elasticsearch
# This retrieves the latest ElasticSearch package for our use and installs it

$ sudo nano /etc/elasticsearch/elasticsearch.yml
Here we edit the elasticsearch.yml file to ensure that we have the correct network host. We search for and make sure the line network.host: “0.0.0.0” reads as it does here. Be sure to save the file before exiting and then restart ElasticSearch:
$ sudo service elasticsearch restart
Install Logstash
Our next step is, of course, to install Logstash. These steps differ slightly from the ElasticSearch installation, but they’re pretty easy to follow as well:
$ sudo apt-get install apt-transport-https
$ echo “deb https://artifacts.elastic.co/packages/5.x/apt stable main” | sudo tee -a /etc/apt/sources.list.d/elastic-5.x.list
$ sudo apt-get update
$ sudo apt-get install logstash
$ sudo service logstash start
This will get us up and running with Logstash. With the Raspberry Pi, this installation might take some time.
Install Kibana
Installing Kibana will take a combination of methods. Since the Raspberry Pi runs on ARM instead of Intel, it’s important to get the 32-bit .deb package of Kibana. It can be downloaded directly from Elastic and unpacked into the /usr/share/kibana folder:
$ sudo mv ~/Downloads/kibana-5.4.2-i386.deb /usr/share/kibana
$ sudo dpkg -x kibana-5.4.2-i386.deb /usr/share/kibana
And, as in every ELK setup, we need to ensure that the proper network setups are ready to roll. Edit the lines referring to server.port and ensure they say server.port: 5601 and server.host: “0.0.0.0”. It should only be necessary to uncomment these lines and then start Kibana:
$ sudo service kibana start
Once everything is in place, we should see the ELK Stack is up and running:

Conclusion
It’s important to be clear that this was an experiment. The best place for getting an ELK Stack up and running is in the cloud (and you can also use Logz.io to jump through all the hoops of setup and maintenance). While we’ve shown that it is possible to get ELK Stack up and running on a Raspberry Pi, this is in no way the recommended method for shipping logs.

You Might Also Like

What’s New at Logz.io – January 2026

