
An Introduction to our New Product: Logz.io Distributed Tracing
November 11, 2020
Yesterday we were excited to announce Logz.io Distributed Tracing, the most recent addition to our Cloud-Native Observability Platform.
This is such a special launch for us because it makes Logz.io the only place where engineers can use the best open source monitoring tools for logs, metrics, and traces – known as the ‘three pillars’ to observability – together in one place. For the first time, you can now use ELK for logs, Prometheus for metrics, and Jaeger for traces altogether on a scalable platform.
The first thing to know about our brand new product is that it provides Jaeger-as-a-service. Our team recognized the quickly growing community behind Jaeger – an exciting open source project and tracing tool that originated in Uber and is now hosted by CNCF. By providing Jaeger as a managed service, engineers can use the open source they love without managing it themselves.
A few Logz.io customers have already tried it. One of our customers, Duda, made the transition from open source Jaeger to Logz.io Distributed Tracing – read about their experience here!
If you’d like to give it a go, contact us and we can help you set up an environment for you. A self-service option will be ready on November 30th! To learn more about implementation, check out our docs.
Here is a quick look of what Logz.io Distributed Tracing has to offer…
A Brief Introduction to Tracing and Logz.io’s Jaeger-based Solution
The first step is to get traces into Logz.io. To do this, you’ll need to instrument your desired applications to expose the relevant traces. Logz.io supports common tracing protocols, including Jaeger, Zipkin, OpenTracing, OpenCensus and the new OpenTelemetry.
Instructions for instrumenting your apps with each of these technologies is out of scope for this post. Check out our documentation to learn more about how to instrument your system to expose traces.
Let’s explore the benefits of Logz.io Distributed Tracing once you have your traces in the Logz.io app…
Upon opening up the product, you’ll have the option to investigate a number of traces, which represent various application requests in your system. You can search for your desired trace by filtering for the service, operation, tags, trace duration, and timeframe of interest.

Clicking on a trace will bring up the timeline view of a trace, which looks like this:

If you’re unfamiliar with tracing, the bars that go across the middle are spans, which represent individual units of work done by each microservice. Together, the spans make up the trace. The left column provides labels to show the associated microservice and operation for each span.
You can follow the spans to see which microservices were called during the request, and how long it took for each microservice to do its job (represented by the length of each bar). This provides a clear window into the latency of each task and makes it immediately clear where the bottlenecks are.
If we look at the series of Redis calls, we can see that two of them have red exclamation marks and took a bit longer to execute. If we open up those spans, we can immediately see that a Redis timeout is causing the issue.

And that’s the power of tracing. You can quickly isolate and explore problems in the context of the larger request and interactions between multiple microservices.
Jaeger provides other ways to view your tracing data to make it easier to extract new insights. The ‘Trace Graph’ view clearly shows the sequence of calls to different microservices within a request.

Within this view, you can compare a trace with high latency and another with better performance to immediately highlight the difference between the traces and the probable cause of the latency. Here, the comparison feature immediately shows the Redis timeout as the key difference causing high latency between two traces.

Exploring the unique benefits of tracing with Logz.io’s high-powered Jaeger
In addition to providing Jaeger as a fully managed service, we’ve also added capabilities on top of Jaeger to make it faster and easier to detect and resolve production issues in your microservices.
The first capability we’ll discuss, and my personal favorite, is log-trace correlation. This allows you to explore the logs associated with a specific trace, and vice versa. To go from traces to logs, just hit the ‘Explore in Kibana’ button at the top left of the screen.

Now, we can see the traces (as logs) in Kibana! This brings up the traces we just saw in Jaeger, as well as additional logs that are not shown in Jaeger. As a result, users see the surrounding documents for the trace to get more context on what happened within the sequence of calls.
This feature works by searching for logs with the relevant trace id in our Log Management product, which is based on the ELK Stack.
Since the traces are in Logz.io Log Management, we can use Kibana’s powerful visualization capabilities to slice and dice the traces in interesting ways to extract more insights from the data.
The visualization below compares the latency of our requests (a signal that traces show uniquely well) from last week to this week.

While this visualization breaks down our traces by service to show how our various microservices compare by latency.
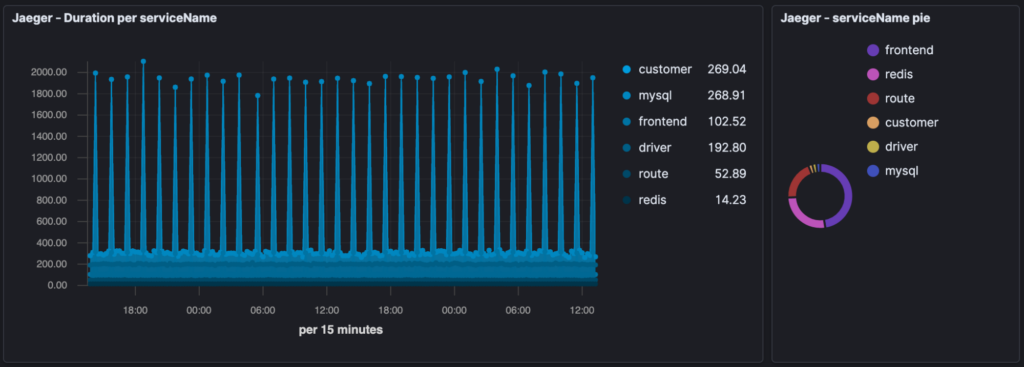
And lastly, this visualization highlights the traces with errors, so we can quickly narrow in on the bottlenecks. You can see the same Redis microservice we saw in Jaeger showing up in the legend.

You get the idea…once traces are in Kibana, there are unlimited ways to slice and dice the data to draw different insights.
The next capability we built on top of Jaeger is alerting, so you can stay notified of problematic requests before they impact too many users (or whatever you may be monitoring for).
The beauty of our Distributed Tracing alerts is that they are the same as our Log Management alerts – same UI, same experience, same capabilities. To create an alert for those Redis errors, we can simply query for those same traces in Kibana and hit ‘Create alert’.
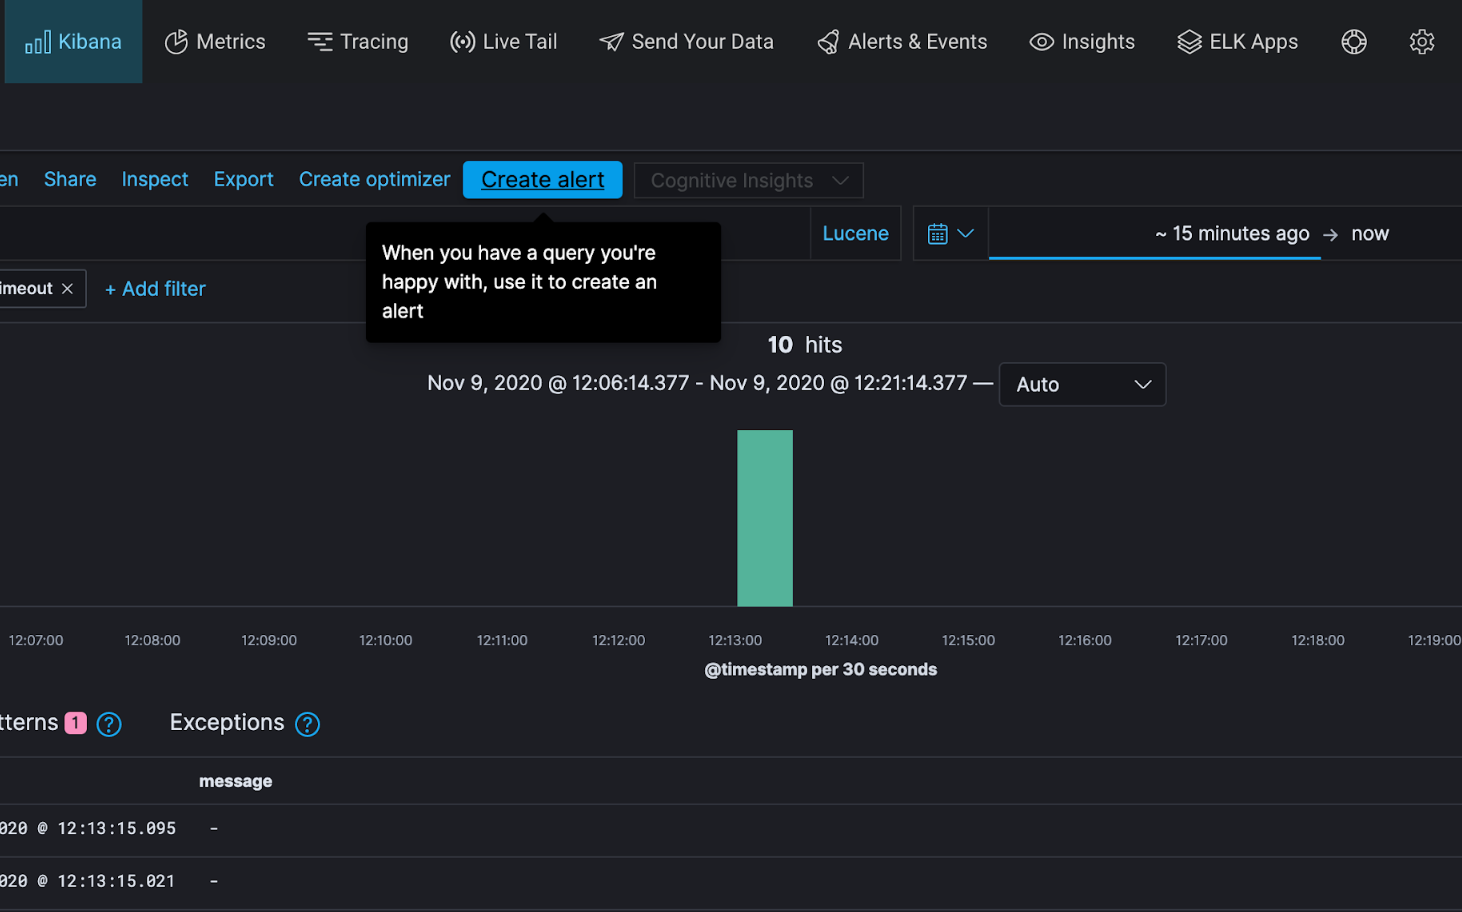
Create an alert for traces in Logz.io’s UI of Kibana
This carries over the query to our alert configuration. Now, we can define the trigger condition and set an end point. For the trigger condition, let’s have it trigger everytime we see another Redis timeout (number of logs…in the last 5 minutes… is greater than 0) and send the alerts to our alerting Slack channel.

That’s it. We’ll now know right away if we have Redis timeouts in the future.
In this case, the alert will trigger whenever it sees another Redis timeout. But we can also configure alerts to notify on things like average latency, maximum latency, and more.
Log-trace Correlation and Alerting are two of the features we’ve built on top of Jaeger to make it easier to identify and resolve production issues. Like the rest of our product portfolio, we’ll be constantly adding to the solution for a more seamless monitoring and troubleshooting experience.
If you’re interested in seeing a demo or trying it for yourself, contact us and we’d be happy to help you!

You Might Also Like

Application Observability in 2024: An Ultimate Guide

