
The World Of Cloud-Native Monitoring
August 13, 2019

Logs have always been a crucial part of applications, providing insight into an application’s every operation and auditing all of its activities. Yet to date, logs have been used primarily for researching incident details or applicative failures. Only recently have R&D and operations teams started paying closer attention to logs in an effort to identify incidents as they occur and recognize trends that can prevent future pitfalls. More on the subject:
These days, monitoring systems, tools, technologies, and methodologies have grown to be fundamental components of every production ops team’s work. Today, it is expected that databases, cloud infrastructures, backend services, client-side apps and even the monitoring systems themselves be monitored for detection, prevention, and protection of these systems. This article will explain how monitoring became more commonplace and how it evolved side-by-side with cloud technology.
What Does Cloud Monitoring Mean?
Software organizations have always needed to conduct root cause analyses. Ops teams have had to be accountable for and have the knowledge of every event in the application for financial, reputation, and security reasons. For a long time, application logs, especially for on-premises software, were the only solution. Infrastructure was usually referred to as just another of the application’s dependencies that ops had to build and maintain in order to facilitate the software’s functioning. During the first decade of the millennia, the information explosion made cloud computing essential for organizations. It provided scaling abilities and exempted DevOps from focusing on the infrastructure management and maintenance. Once this happened, app logs were no longer cutting it.
When both infrastructure and application services became flexible and scalable, these components’ logs had to become elastic as well. Using the cloud for managing and tracking these logs was the obvious first step. At this point, monitoring methodologies started to unfold, taking logging to its next phase. Facilitating post-incident inquiries was no longer the primary reason ops teams resorted to logs; identifying security incidents and providing real-time status updates became their main function.
Composing the right cloud monitoring solution requires an understanding of the current loads on all system components and using the right tools to predict and prevent issues created from this load.
Cloud monitoring can also be leveraged for security purposes. Identifying offensive activities in real-time and recognizing malicious persistent software in the application or the infrastructure is not only feasible, it amplifies the value monitoring has for the production environment. Cloud monitoring expands this process to cloud components such as databases, cloud network configurations, security tools, cloud storage, and IAM that were rarely monitored previously.
Still, simply monitoring is not enough. Now that every application handles and collects a huge amount of data, visualizing the right information, digging deeply into one event to explore its sources, and having the ability to automatically model normal behavior and detect anomalies are only some of the features that monitoring systems can provide for ops teams in order to simplify their day-to-day workloads.
Monitoring Systems and Methodologies
When tracking evolved into monitoring, different infrastructure management tools began adding inspection and observation modules to their existing solutions. These modules were missing critical information, so they were presenting only a part of the whole picture—sometimes an incorrect one. Monitoring designated systems started to pop up at the beginning of the 2000’s with Splunk being the leader of the industry at the time.
Over the next decade, more and more systems and tools were created to deliver improved visibility, better visualization, and granular insights into the software stack. Tools like Datadog, Sumo Logic, Zabbix and Nagios provided wide and deep status insights into applications according to their logs and the infrastructures they were based on. However, these tools were designed for stable, unvarying, and reliable applications that were usually based on on-premises infrastructures. Elasticsearch (2010) and Prometheus (2012) were game changers. These tools were built deliberately for supporting cloud based apps, with the understanding that applications constantly transform and are just one of the layers of the monitored product. The creators of these tools recognized that cloud services (especially cloud managed services) must also be monitored and that the ability to scale them together with the application is embedded in their architecture.
Nevertheless, the capacity of these tools alone is not enough. Cloud providers (primarily AWS, GCP, and Azure) have a lot of data in their in-house monitoring tools (CloudWatch, Stackdriver and OMS). Modern cloud monitoring systems have the ability to integrate with the providers’ tools, collect relevant data, and present a comprehensive view of the cloud infrastructure status, while being able to do a deep dive into the different modules the application is using. Kubernetes is a common example of a managed orchestration service into which DevOps teams require profound visibility. ELK (Elasticsearch Logstash Kibana Stack) and Grafana can both provide this visibility.
Elasticsearch is built for collecting a huge amount of data from a wide variety of different services, unifying it into a small amount of visualizations and manufacturing a clear status for the system.

Dashboards of Elasticsearch using Kibana
In its APM, Timelion and ML modules, ELK satisfies both dev and DevOps team needs. These needs include endpoint performance inspection and the combination of information from different data sources into one interface in order to provide better understanding of API behavior and decrease incident investigation time.
While Elasticsearch is more logs-and indexes-oriented, displaying the status of application logs as well as of the Kubernetes nodes and pods, Prometheus is built entirely for metrics and performance KPIs. It provides a view of all possible indicators that help determine the state of both the system as a whole and each of its components.
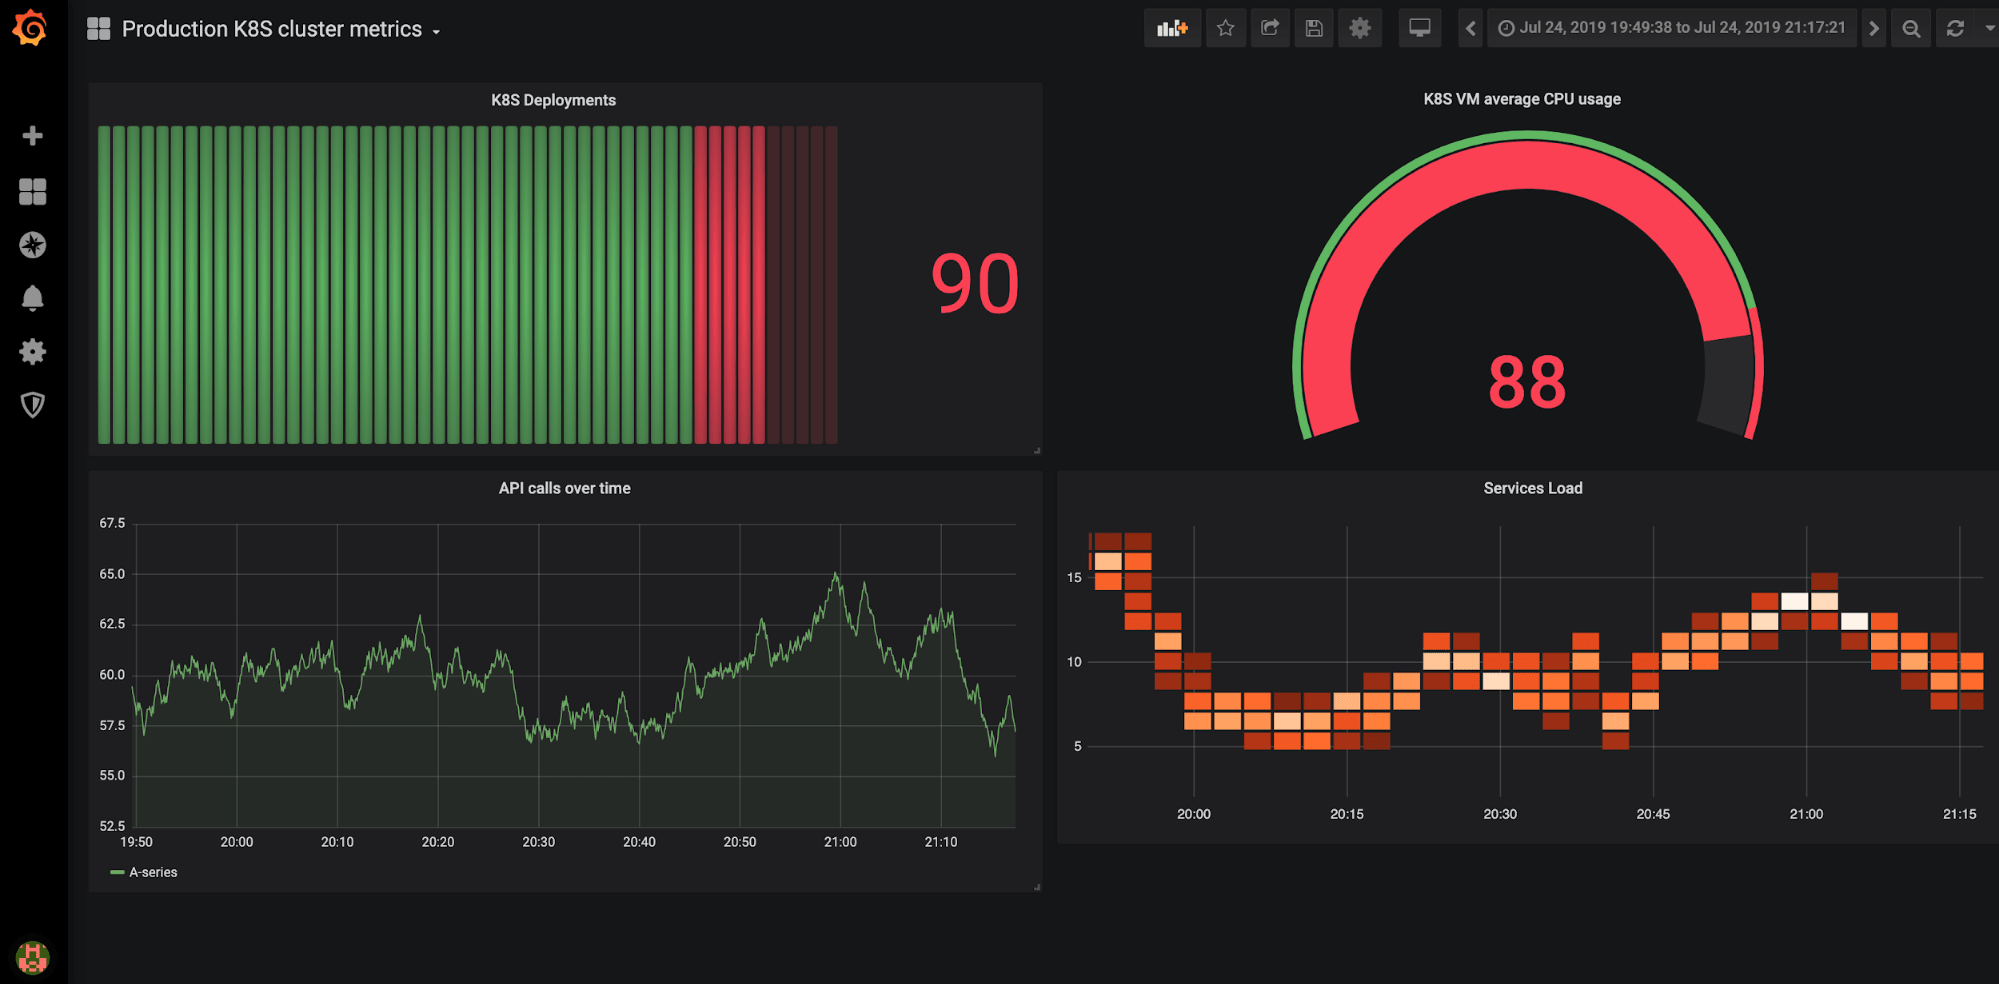
Grafana with Prometheus Kubernetes metrics
Prometheus fits so well into the Kubernetes stack that it can even behave as the load knowledge base, providing Kubernetes with the information required to make horizontal pod autoscaling decisions (read more on this process here).
Monitoring at Cloud Scale
Prometheus and ELK are important tools for the cloud-native monitoring toolbelt, for all the reasons delineated above. But as the information coming from cloud environments (especially Kubernetes-based) explodes, these open source tools need to be managed expertly in order to make sure they scale to handle the data influx. If they aren’t, they run the risk of collapse, and of even losing important or sensitive data, and rendering the teams using these tools without a solution. Hosted, or better yet fully managed services can alleviate this pain, ensuring that the monitoring systems can handle any scale of data without the worry of failure or time-investment of daily management.
Summary
In the age of cloud infrastructure, software stacks are constructed of a wide range of components with various logics. DevOps teams that manage cloud-based applications demand systems that can consolidate data from different components (on-premises, cloud-based, and even cloud-managed) in order to predict application and security incidents and explore unusual events. Cloud monitoring systems must be able to scale alongside the applications they monitor while continuing to allow DevOps and security engineers multiple observations as events are happening.
As migration to the cloud continues, cloud monitoring will have to evolve and continue to provide new information about applications.

You Might Also Like

The 2025 Wake-Up Call for Engineering Teams

