Benchmarking Elasticsearch with Magnetic EBS
June 21, 2017

Over a year ago, I published a benchmark we performed for running Elasticsearch on AWS. The goal of this benchmark was to try and figure out the most cost effective instance type to rock your Elasticsearch cluster.
A few months ago, at AWS re:Invent, we had a chat with Amazon’s EBS team. They said that they really believe in their new ST1 and SC1 magnetic disks and that we should run the benchmark again on those disks. We decided to team up. Disclaimer ahead — the EBS team ran the tests for us, based on our tool, guidance and supervision. All that is written below is my impartial, unbiased conclusions based on the results.
We assumed several things in the previous benchmark, and since we are testing disks now, we could no longer neglect searches and caches.
About the test tool
First things first — we are a logging company that provides a hosted and fully managed ELK solution. We care about how Elasticsearch is behaving under log analysis load, and this is what we tested.
Elastic has its own tool for testing, Rally. Since Elastic has to support all methods, use cases, and operations, this tool is, by definition, complex. We needed something simpler that imitates log indexing and Kibana searches.
So we ended up writing this tool. The tool is a really simple abstraction of benchmarking. You specify a plan, run a Docker container, and get the results on graphite. As simple as that.
We configured the tool to index documents for only thirty minutes and then run indexing and searching in parallel for fifteen additional minutes.
Each indexing and search operation was running from five different threads, and these units were multiplied until saturation (i.e., the CPU on Elasticsearch was >= 80%).
We also wanted to eliminate all caching, since we needed to test the volume fully. So, we ended up cleaning both Elasticsearch and the OS caches every minute.
How does the tool work?
There are five different log-like documents with timestamp placeholders and field values placeholders. The test tool generates a list of possible field values and assigns (at index time) a value to the field along with the current timestamp.
Based on those logs, there are five different searches that simulate Kibana dashboards based on the sample data.
Indexing was done in 1K bulks, and searching was done back to back.
The tool is written in Java, using Jest for all Elasticsearch operations, exposing metrics in JMX, and then sending those to graphite via our own jmx2graphite java agent.
We also placed our own es2graphite container to see Elasticsearch metrics and collectd to see host metrics.
The Test Matrix
We ran the test tool only on the m4 series, as those are the instances we found to be best suited for our needs in our original benchmark.
Our goal was to figure out if we can save money on EBS disks by moving to the magnetic tier without compromising performance whatsoever.
We started at m4.2xlarge and went all the way up to m4.16xlarge — while changing the disk size for each test.
We know what is the max throughput for each disks using this document from AWS, and we know what is the max throughput of each instance using this document.
Using those numbers, we built an effective coupling of disk + instance.
For example, placing a 16TB ST1 disk on a m4.4xlarge is not effective performance-wise, since although the disk can give us 500 MiB/s, the instance is capped at 250 MB/s. The max size we can have performance benefit from is 7TB as baseline.
On GP2 disks, the situation is a bit different as they reach their max speed at 4TB — so we just matched them to the ST1 and SC1 size to ignore all other possible noise.
We ran each test configuration three times and took averages. Each test was indexed to one index, with one shard and no replicas. The index was cleaned between tests.
Elasticsearch and EBS
It has been a long-time recommendation from Elastic not to use EBS disks on Elasticsearch clusters.
As I wrote in the previous benchmark, we are challenging that recommendation constantly.
While it’s true that the best performance would be achieved using local SSD disks, the cost of doing so is usually not worth it.
So this piece is not about comparing local SSD to EBS because it would not be a fair comparison. It is about comparing EBSs.
On a personal note, after more than a year and a half using EBSs in production with Elasticsearch — it’s working great. Very few things actually need local SSDs, but that’s for another time.
Results!
I know my audience. Let’s view some graphs!
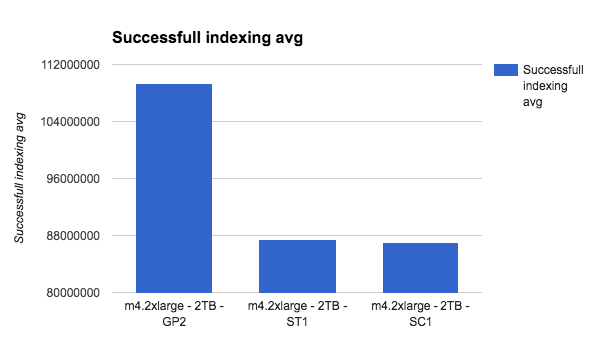
So first, the m4.2xlarge:
No surprise there. GP2 should be much faster at write time.
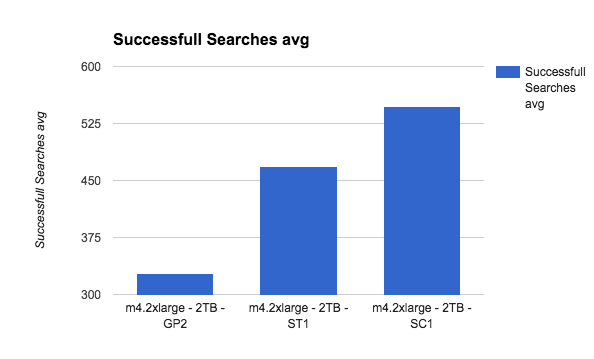
But check this out:
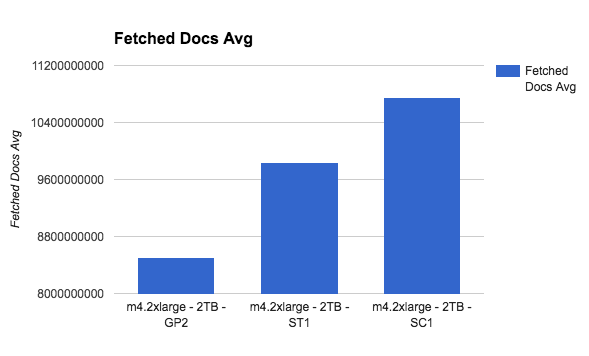
This is getting interesting!
SC1, the slowest disk of them all, gives the best search performance.This is probably tilted, though, since the data is on one index with one shard and more sequential than real life load.
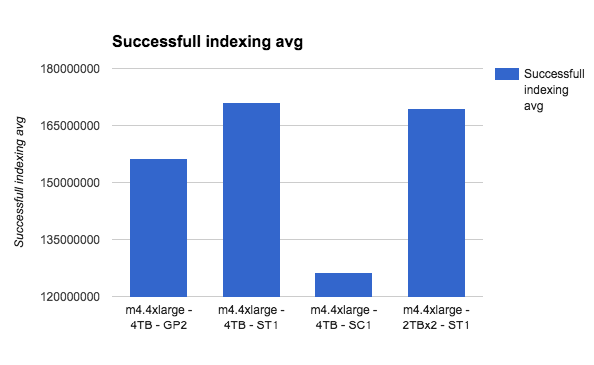
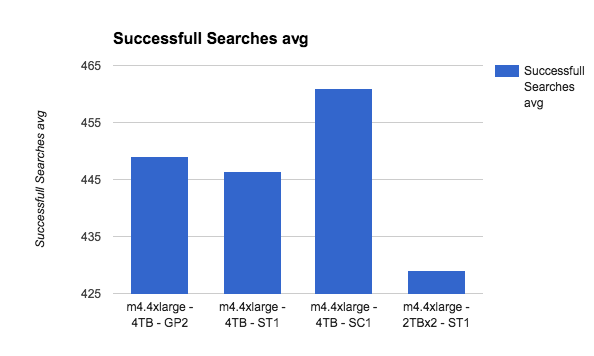
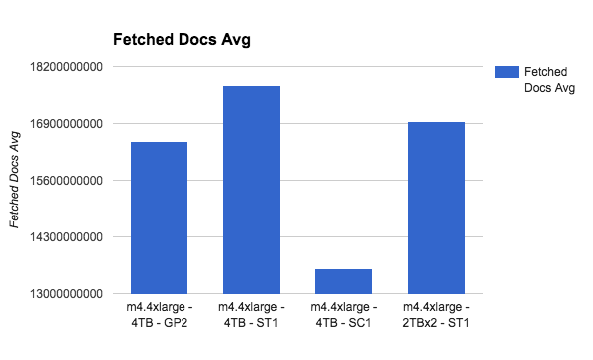
Let’s see m4.4xlarge:
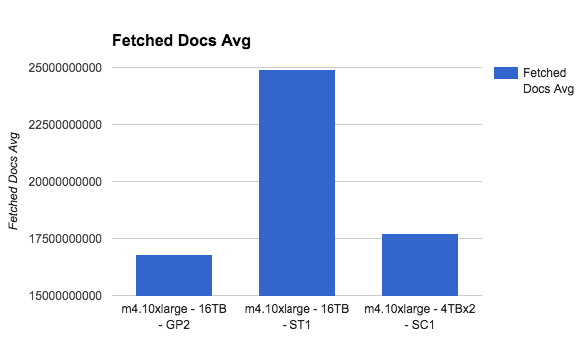
Magnetics to the win here? Although SC1 is higher on total amount of searches, the actual fetched documents on ST1 is higher, and this is the more valuable metric here — how many documents was actually read from disk.
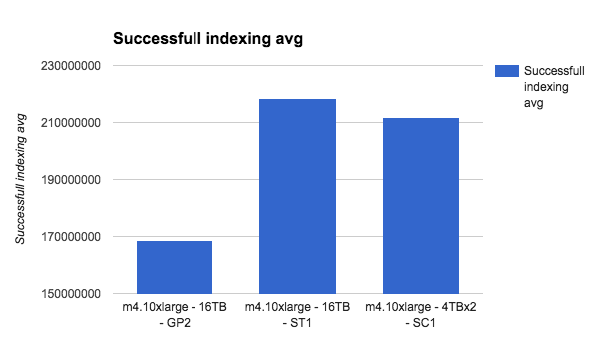
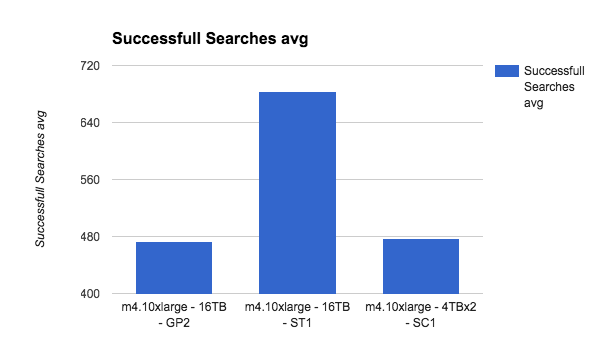
Things get clearer as we go up with the instance type. Lets see the m4.10xlarge as a last example:
As the instance capacity gets bigger, the more bandwidth it can utilize from the disk, thus passing the GP2 limitations easily.
We even ended up running the test again on m4.4xlarge, with even more threads just to see that we are not wrong. We weren’t — the results were consistent with the previous tests.
Our Conclusions
Honestly, the results surprised me.
Not only we can reduce a total node cost (m4.4xlarge + 4TB GP2 disk on us-east-1) from $976 a month to $756 per month (ST1 4TB costs $180 instead of $400 for GP2 of the same size), we can even get better performance.
More on the subject:
I know that this is a controlled test environment, but the data is still pretty conclusive.
We haven’t validated this thesis on a production load yet, but we are planning to soon.
