
A Guide to Monitoring AWS Lambda Metrics with Prometheus & Logz.io
July 19, 2021
In this post we will discuss some key considerations and strategies to monitor your AWS Lambda functions. This will include: which Lambda metrics you’ll want to monitor, how to collect AWS Lambda metrics with Prometheus and Logz.io, how to create a monitoring dashboard with alerts, and how to search and visualize your metrics.
Key AWS Lambda Metrics to Monitor
The following section briefly highlights key Lambda metrics to monitor to effectively understand their behavior and identify problems. There are three key categories of AWS Lambda metrics:
1. Invocation metrics
- Invocations – The number of times your function code is executed, including successful executions and executions that result in a function error.
- Errors – The number of invocations that result in a function error.
- DeadLetterErrors – For asynchronous invocation, the number of times Lambda attempts to send an event to a dead-letter queue but fails.
- Throttles – The number of invocation requests that are throttled, which when a Lambda intentionally rejects a request and does not execute the function.
- ProvisionedConcurrencyInvocations – The number of times your function code is executed on provisioned concurrency.
- ProvisionedConcurrencySpilloverInvocations – The number of times your function code is executed on standard concurrency when all provisioned concurrency is in use.
2. Performance metrics
- Duration – The amount of time that your function code spends processing an event.
- IteratorAge – For event source mappings that read from streams, the age of the last record in the event.
3. Concurrency metrics
- ConcurrentExecutions – The number of function instances that are processing events.
- ProvisionedConcurrentExecutions – The number of function instances that are processing events on provisioned concurrency.
- ProvisionedConcurrencyUtilization – For a version or alias, the value of ProvisionedConcurrentExecutions divided by the total amount of provisioned concurrency allocated.
For more information on these metrics, check out the detailed documentation in the AWS docs.
Now that we know which metrics to monitor, let’s set up some dashboards to monitor them. While Lambda metrics are automatically published to Cloudwatch, most engineering teams prefer other solutions to collect and analyze their metrics.
Let’s check out how we can use Prometheus and Logz.io to collect metrics at scale so they can be searched and analyzed.
Collecting and Monitoring Lambda Metrics with Prometheus and Logz.io
Now comes the fun part. To put the metrics described above into action, we’ll need to collect the metric data and build dashboards to monitor them. We’ll do these things with Prometheus and Logz.io.
But metrics don’t show the full picture of what’s happening with your lambdas. Once we identify problems in metrics monitoring dashboards, we’ll also need log data to troubleshoot the problems. We will also show how to correlate your metrics with the associated logs on Logz.io.
Let’s get started.
Collecting and Analyzing Metrics with Prometheus and Logz.io
Before we get to set up the monitoring dashboards, we’ll need to get the metric data into our monitoring solutions.
In this section, let’s pull Lambda metrics from CloudWatch with Prometheus. And then if you’d like to try it, you can follow along to forward those metrics to Logz.io’s Prometheus-as-a-service for scalable storage and analysis.
If you’re NOT interested in using Prometheus to collect your Lambda metrics, check out these directions for sending your metrics straight from CloudWatch to Logz.io with the otel/opentelemetry-collector.
How to Pull Lambda Metrics in Cloudwatch to Your Prometheus Server
Assuming you already have Prometheus installed, let’s start pulling Lambda metrics from Cloudwatch (where they are automatically published) to a Prometheus server so we can monitor them.

To scrape the metrics, we will use yet-another-cloudwatch-exporter. Capable of exporting metrics for a lot of AWS services, we’ll stick to exporting AWS Lambda metrics with it for now.
Here is an example of the yet-another-cloudwatch-exporter config file (in yaml):
discovery:
 jobs:
   - regions:
       - us-east-1
     type: lambda
     enableMetricData: true
     metrics:
       - name: Duration
         statistics: [ Sum, Maximum, Minimum, Average ]
         period: 300
         length: 3600
       - name: Invocations
         statistics: [ Sum ]
         period: 300
         length: 3600
       - name: Errors
         statistics: [ Sum ]
         period: 300
         length: 3600
       - name: Throttles
         statistics: [ Sum ]
         period: 300
         length: 3600
       - name: DeadLetterErrors
         statistics: [ Sum ]
         period: 300
         length: 3600
       - name: DestinationDeliveryFailures
         statistics: [ Sum ]
         period: 300
         length: 3600
       - name: ProvisionedConcurrencyInvocations
         statistics: [ Sum ]
         period: 300
         length: 3600
       - name: ProvisionedConcurrencySpilloverInvocations
         statistics: [ Sum ]
         period: 300
         length: 3600
       - name: IteratorAge
         statistics: [ Average, Maximum ]
         period: 300
         length: 3600
       - name: ConcurrentExecutions
         statistics: [ Sum ]
         period: 300
         length: 3600
       - name: ProvisionedConcurrentExecutions
         statistics: [ Sum ]
         period: 300
         length: 3600
       - name: ProvisionedConcurrencyUtilization
         statistics:
         - Maximum
         period: 300
         length: 3600
       - name: UnreservedConcurrentExecutions
         statistics: [ Sum ]
         period: 300
         length: 3600
Once the right credentials and configurations are all set you can run the cloud watch metrics exporter locally like below:
docker run --rm -v $(PWD)/credentials:/exporter/.aws/credentials -v $(PWD)/yace.yml:/tmp/config.yml -p 5000:5000 --name yace quay.io/invisionag/yet-another-cloudwatch-exporterThen you will be able to see metrics in port 5000 as shown below. You can see that dev-generate-random-errors Lambda metrics are being reported. Please find the details on running and configuring yet-another-cloudwatch-exporter in their official github repo.

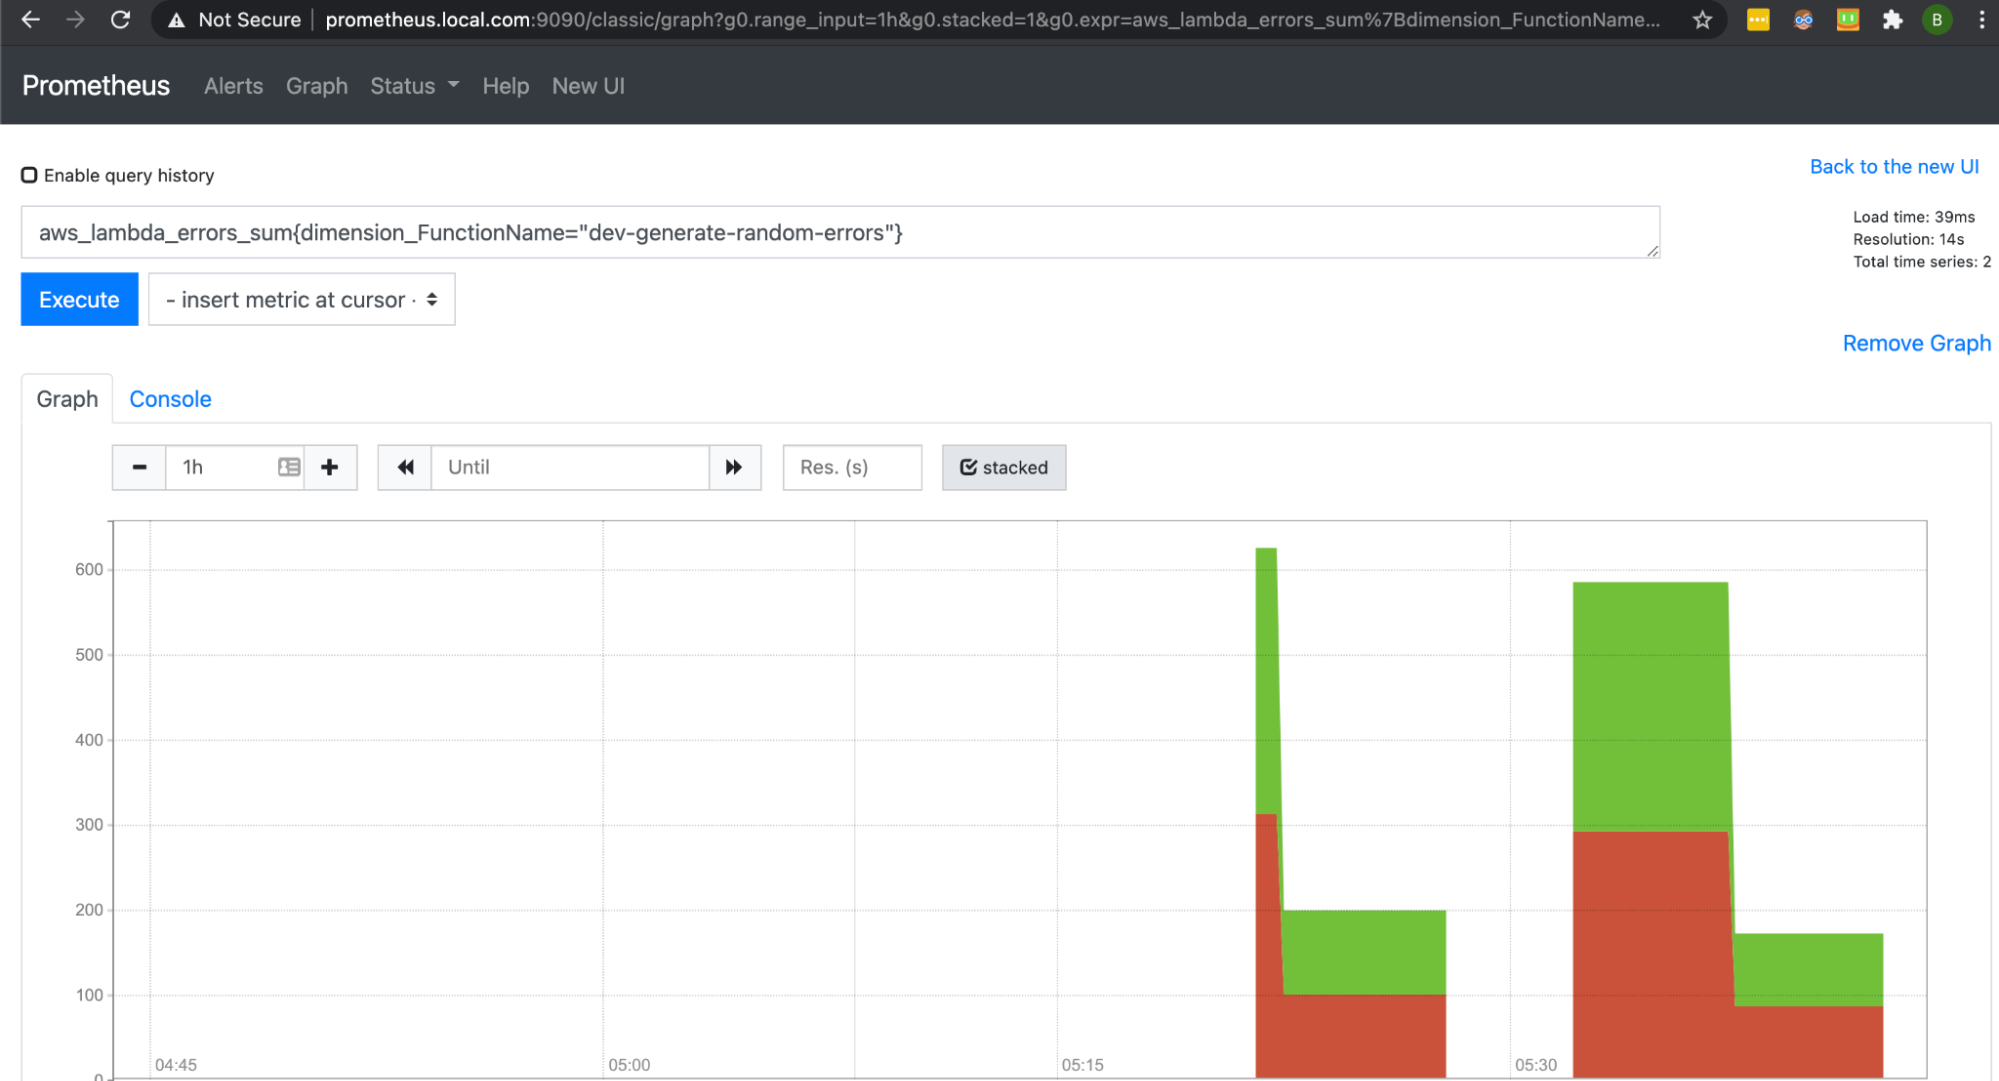
Using PromQL Queries
Now that Prometheus is configured successfully, we can query AWS/Lambda our metrics using the PromQL query language.
The diagram below shows the query result of our aws_lambda_errors_sum of the dev-generate-random-errors Lambda metrics.
Prometheus is a widely popular way to collect metrics from Lambda functions. But oftentimes, Grafana will analyze these metrics due to Prometheus’s limited visualization capabilities. Learn more about how these tools work together here.
This example shows a small volume of metric data. But Prometheus servers and roll up servers can be a lot to manage, upgrade, and maintain at large scales. Plus, you’ll need a totally separate solution for logging, which can slow down your monitoring and troubleshooting workflows and can lead to tool sprawl.
These are the reasons Logz.io built Prometheus-as-a-service, which collects all your Prometheus metrics on a scalable SaaS platform for long-term storage. Plus, it unifies your metrics alongside your log analytics, which consolidates your and makes it faster to monitor and troubleshoot your lambdas.
Forwarding Prometheus Metrics to Logz.io for Scalable Storage
Logz.io offers a scalable Prometheus-as-a-service solution called Infrastructure Monitoring.
All we have to do to forward our Prometheus metrics to Logz.io Infrastructure Monitoring is add the remote_write url to our prometheus.yml config file. This will automatically forward all the metrics collected by Prometheus to a remote destination – in this case, Logz.io.
Just open a free Logz.io account, add the remote_write parameters to the config. It’s not complicated, but please find the detailed documentation here to set it by yourself.
Here is an example prometheus.yml file. Note that you’ll need to add the account token – which you can find in your Logz.io account page – to the file:
global:
 scrape_interval: 60s
 evaluation_interval: 60s
 external_labels:
   p8s_logzio_name: LambdaMetrics
scrape_configs:
 - job_name: 'cloudwatch_yet-another-exporter'
   scrape_interval: 30s
   static_configs:
     - targets: [<exporter-host-ip>:5000]
 - job_name: 'prometheus'
   scrape_interval: 5s
   static_configs:
     - targets: ['localhost:9090']
remote_write:
 - url: https://listener.logz.io:8053
   bearer_token: <Metrics Account Token>
   remote_timeout: 30s
   queue_config:
     batch_send_deadline: 5s
     max_shards: 10
     min_shards: 1
     max_samples_per_send: 500
     capacity: 10000
Now, all your metrics automatically will both scrape from CloudWatch and automatically forward to Logz.io for long term storage and analysis. In other words, you can keep your existing Prometheus servers in place, without needing to manage the data storage at scale. Plus, your metrics can be unified with log and trace analytics:

Creating AWS Lambda Metrics Monitoring Dashboards
Now we can set up monitoring dashboards in Logz.io that monitors our generate-random-errors Lambda. Creating new monitoring visualizations (called panels) is easy. Hit the ‘Add panel’ button, select the data source, and add the PromQL query to visualize the desired metrics:

The query above monitors all our errors from the function. After hitting save, you can see the new visual in the top right panel below.
We also added panels that monitor latency (which measures the average and max durations of all the invocations), throttles, invocations, and global concurrent executions – a good start on the list of metrics to monitor in the ‘Key AWS Lambda metrics to monitor’ section.

But nobody wants to stare at a dashboard all day to see if something goes wrong, so we can set alerts to do that for us.
Setting Up Logz.io Alerts
The alert below triggers automatically when the Lambda error count is greater than 17 (random count) on every minute evaluated for the last 2 minutes. You can set the threshold by dragging and dropping the highlighted heart up and down the y axis.
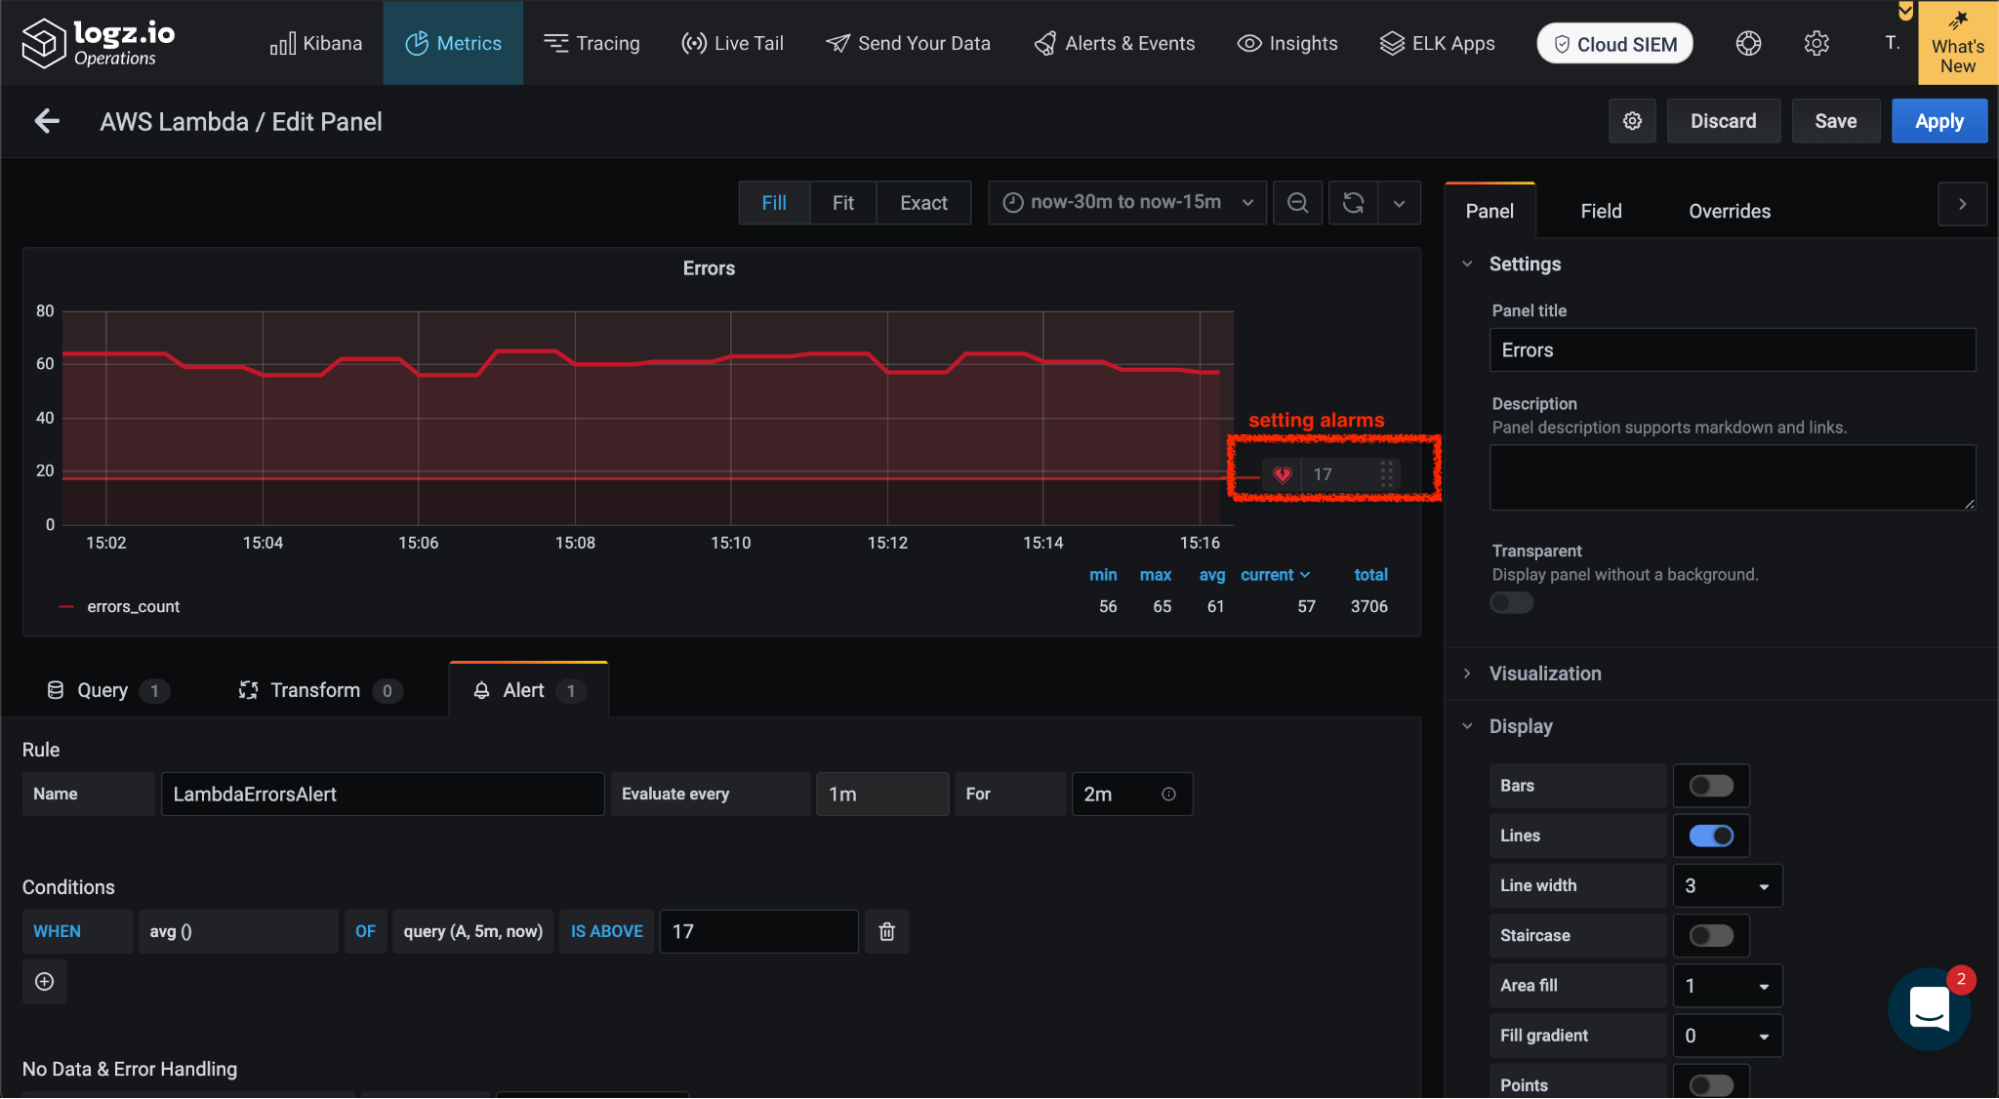
Then, we can configure the alert to notify us when it triggers with endpoints like Slack, PagerDuty, VictorOps, ServiceNow, OpsGenie, Gmail, and many other alerting endpoints:

In the real world, after being alerted of spiking Lambda metrics, we’d immediately want to investigate the related logs to debug the problem. This would normally require accessing a separate system to begin querying the logs.
But Logz.io also offers a Log Management solution, so we can correlate our error metrics with the associated logs to immediately bring up the logs that explain the spiking metrics by hitting this link we’ve added:

Hitting this link brings us straight to the relevant logs so we can debug any problems in our lambdas.

But how did we get our Lambda logs into Logz.io you may ask? Check out our Lambda logging blog to learn more.
Your Monitoring Game Plan
Go into your Lambda monitoring journey with a game plan. First, review the metrics we covered in the ‘Key AWS Lambda Metrics To Monitor’ section to decide exactly what you want to monitor.
Once you know which metrics you want to monitor, the next question becomes how you’re going to collect and analyze the data. Most of today’s ‘monitor-ers’ choose Prometheus. It’s easy to set up and integrate with modern stacks to collect your metrics. But there are a few considerations.
The first is scale and time. The data we used in this example was very small-scale. More realistic production environments require tools to effectively ingest and store huge quantities of data.
Using Prometheus for this is doable – some of the best engineering teams in the world use it. The question for you is whether or not your team has the time and resources to manage it.
The next consideration is whether you want your metrics and other monitoring data (logs and/or traces) all in one place, or if you’re okay with having them spread out.
Logz.io is a good alternative for teams that want somebody else to manage these open source tools and/or because they want all of their monitoring data together.
If that’s the case for you, try Logz.io for free here. Otherwise, Prometheus is your best bet.

You Might Also Like

Tool Consolidation Is Dead. Long Live Agentic AI.

