
AWS Elastic Load Balancing (ELB) and Monitoring
July 2, 2018

Companies today can’t afford to have an application succumb to a spike in traffic or fail due to an overload of user requests. Two of the key benefits of cloud computing today are elasticity and scalability, both of which help ensure an application’s optimal performance.
Elasticity enables horizontal scaling for an application to meet real-time demand, and scalability allows an application’s existing system to handle an increased amount of work. Maintaining these two elements is why Elastic Load Balancer (ELB) has become such a critical necessity if AWS is your public cloud provider that is.More on the subject:
With a multi-layer infrastructure that distributes user requests over a number of computing resources instead of a single machine, applications can achieve the elasticity needed to meet demand without the risk of failure. ELB also enables autoscaling (Auto Scaling Groups) to handle any increase and decrease of traffic an application experiences, with high availability as well as monitoring (CloudWatch) to boot.
AWS has provided managed load balancing for some time. But in recent years, new developments in load balancing have significantly increased an application’s ability to attain even greater flexibility and performance.
Single-Machine vs. Tiered Architecture
When an application depends on a single machine, any time a web server’s capacity is breached, too many users send requests at once, or an update is run, downtime can occur. Problems can be exacerbated when that same machine is also running a database, and if repairs are needed, you’re out of luck. For larger and growing companies that are facing an increasing need to scale up due to higher demand, a more efficient and flexible option for routing user requests is required.
AWS’ Elastic Load Balancer uses a three-tier architecture to provide just this. All user traffic is distributed over various Amazon EC2 instances, and ELB itself is in a separate Amazon Virtual Private Cloud (VPC), ensuring high availability. Auto Scaling Groups also make sure any spike in demand is scaled horizontally, so that hosting, incoming requests, and outgoing answers are all handled in a seamless, flexible manner without the risk of overload or failure.
Not Just One ELB
There are multiple load balancing services available, with three types provided by AWS: classic, application, and network.
Classic Load Balancer
This is really only an option for those with applications in Amazon’s earlier version of their current VPC—the EC2-Classic network. This connection-based network essentially just forwards on requests as they come into the backend, allowing for virtually zero control and scale. Although some applications are still in need of CLB and some entities choose to continue to use it, CLB will most likely continue to be phased out over time, especially as most new AWS updates/features will be focused on ALB and NLB.
Application Load Balancer
ALB allows for incoming requests to be distributed to the backend depending on their corresponding header; that is, all traffic is routed based on the original sender’s IP address. Working on the seventh layer of the OSI model and using a round-robin algorithm, requests are not simply sent along to one backend instance but intervened and sorted into various instances per their individual headers. Multiple connections can also be opened in order to handle increased requests as needed. Traffic routing for specific situations and IP addresses, such as hybrid cloud, disaster recovery, and on-premise data centers, can easily be handled as well since the HTTP header for each incoming request can be changed.
Network Load Balancer
This is the newest kid on the block and was introduced by AWS to handle high loads—to the tune of tens of millions of requests per second—with high throughput and low latency. NLB utilizes a flow-hash algorithm on the fourth layer of the OSI model and can route incoming requests to any target group. Due to its ability to handle static IP addresses, NLB also enables you to connect a single Elastic IP address through a chosen subnet.
Which to Use: When & Why?
Although most new implementations of load balancing do not include Classic Load Balancers, there are still reasons some need it. These include, per Amazon’s own CLB page, support for EC2-Classic, TCP and SSL listeners, and sticky sessions using application-generated cookies. But the real interest is in the possible use cases for ALB and NLB.
Application Load Balancers are used for HTTP and HTTPS traffic and enable advanced routing, SSL/TLS termination, and visibility for microservices, containers, and other application architectures. ALB serves distributed architectures best, wherein HTTP header details need to be read; for this reason, ALB allows for great flexibility but is not suitable for encrypted requests.
Network Load Balancers handle only TCP packets and cannot access the details of an HTTP request in the same way as ALB. However, if end-to-end encryption is required, then NLB is the best option as it simply sends traffic—TCP packets—directly to the web server reducing latency and ensuring security from the client to the server. NLB is useful for applications that require fixed IP addresses and high-performance routing.
Both ALB and NLB can handle traffic to dynamic ports as well. The chart below shows a comparison of features for each ELB from AWS itself:
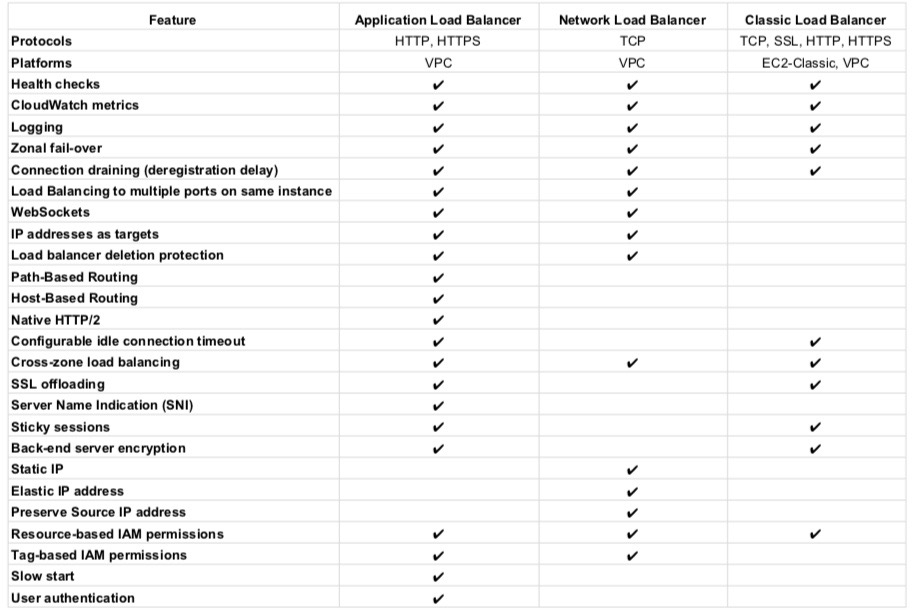
(source: https://aws.amazon.com/elasticloadbalancing/details/)
ELB Monitoring and Logging
Along with these advancements for applications to handle increased user loads comes an even greater amount of data to track and analyze. ELB logs get the ball rolling, but the rest is up to you.
Gathering the Data
When ELB access logging is enabled, all ELB logs are sent by AWS to an S3 storage bucket and are generated every five minutes. The data gleaned from these logs come from the monitoring of any number of metrics, including the operational efficiency of a given ELB, the operating systems and browsers from where requests have come, processing and latency times, which internal machines have been accessed, how evenly traffic is being distributed, and traffic volume per specific geographic areas to name a few.
CloudWatch metrics and alarms and access logs can be used to monitor both ALB and NLB. One of the most important CloudWatch metrics for ELB is the HealthyHostCount, which allows you to track healthy instances in each Availability Zone. Given the absence of surge queues—present in CLB—the Rejected Connection Count is another critical metric for following ALB’s ability to properly connect to a target and route a request.
NLB is a new and expanding service, but presently its vital metrics for monitoring include the HealthyHostCount, ActiveFlowCount, TCP_Client_Reset_Count, TCP_ELB_Reset_Count, and TCP_Target_Reset_Count. Along with CloudWatch metrics and alarms, Cloud Trail and VPC Flow Logs are also useful monitoring tools for this load balancer.
How to Leverage the Data
The issue is that all ELB logs stored by AWS are not necessarily in order or even complete. AWS, in fact, will not guarantee any sort of consistency or the entirety of its logs, offering only that “Elastic Load Balancing logs requests on a best-effort basis.” At this point, you are pretty much on your own to sort through and analyze the data within, data that is of value for maintaining and improving any application’s performance.
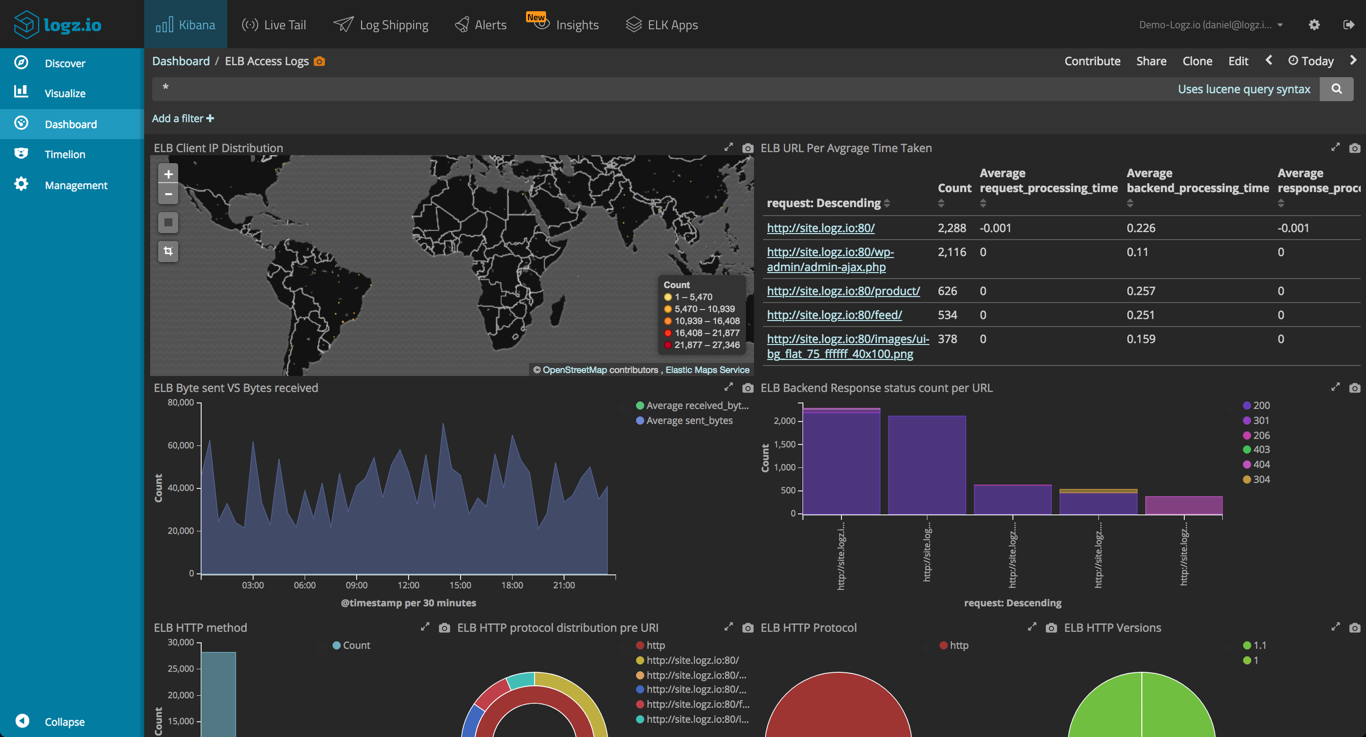
Logz.io’s ELK Stack (Elasticsearch, Logstash and Kibana) enables users to directly import all logs from their S3 bucket and automatically initiates parsing and indexing. You can also configure your bucket to utilize our own ELK deployment. And after Elasticsearch and Logstash have played their parts, analysis can begin in order to glean valuable information from each request that is routed through the load balancer. Kibana not only allows for analysis of metrics such as request breakdown, error codes, and incoming/outgoing traffic, it even sets up a dashboard for easy monitoring—with graphics per your given analytical/data needs.
Summary
AWS’ load balancers, whatever your choice, do an incredible job of routing traffic for an application and storing the data associated with it. The next step, however, is in your hands. Accessing, aggregating, and manipulating this information, be it for mere stats, diagnostics, troubleshooting, or future development, is up to you on your end. The right tools can help you strategically follow and wisely utilize the numerous data points available from your application’s user requests and stay ahead of the curve.

You Might Also Like

Hafnium Hacks Microsoft Exchange: Who’s at Risk?

