
Kubernetes Log Analysis with Fluentd, Elasticsearch and Kibana
Logging is one of the major challenges with any large deployment on platforms such as Kubernetes, but configuring and maintaining a central repository for log collection can ease the day-to-day operations. For that purpose, the combination of Fluentd, Elasticsearch, and Kibana can create a powerful logging layer on top of Kubernetes clusters.
In this article, we will describe how to log Kubernetes using dedicated Fluentd, Elasticsearch and Kibana nodes. To do this, we will define our own pods so that when our cluster is created, the standard output and standard error output for each container is ingested into Elasticsearch and Kibana using a Fluentd agent.

If you are using Google Cloud Platform, a section at the end describes how to use the default logging option for Google cloud.
Collecting Logging with Fluentd
Fluentd is an open source data collector for unified logging layers. In this article, we will be using Fluentd pods to gather all of the logs that are stored within individual nodes in our Kubernetes cluster (these logs can be found under the /var/log/containers directory in the cluster).
Installing and Configuring Fluentd
First, we will need to install Fluentd (for instructions, use these installation guides).
Next, we will install the fluent-plugin-kubernetes_metadata_filter, which allows Kubernetes to create symlinks to Docker log files in /var/log/containers/*.log.
Now, to view the logs from the entire cluster, we have to launch a single instance of the Fluentd agent on each of the nodes. Below is the Fluentd configuration file, which provides the path for the logging directory:
   type tail path
   /var/log/containers/*.log
   pos_file Fluentd-docker.pos
   time_format %Y-%m-%dT%H:%M:%S
   tag kubernetes.*
   format json
   read_from_head true


   type kubernetes_metadata


   type stdout
Running Fluentd
Our next step is to run Fluentd on each of our nodes.
Kubelet is the primary “node agent” that runs on each node and is used to launch PodSpec written in YAML or JSON. We need to specify the pod’s definition in the Kubernetes manifests directory at /etc/kubernetes/manifests (learn how to set this one up in case you don’t have it).
To create the Fluentd pod, use the following yaml configuration (fluentd-pod.yaml):
apiVersion: v1
kind: Pod
metadata:
   name: Fluentd-Elasticsearch
   namespace: kube-system
Labels:
   k8s-app: Fluentd-logging
Spec:
   containers:
   - name: Fluentd-Elasticsearch
   image: < Your fd-image >
Resources:
limits:
   memory: 200Mi
Requests:
   cpu: 100m
   memory: 200Mi
   volumeMounts:
   - name: varlog
   mountPath: /var/log
   - name: varlibdockercontainers
   mountPath: /var/lib/docker/containers
   readOnly: true
   terminationGracePeriodSeconds: 30
   volumes:
   - name: varlog
   hostPath:
   path: /var/log
   - name: varlibdockercontainers
   hostPath:
   path: /var/lib/docker/containers
In this configuration file, you have to provide the Docker image repository from where you will launch the container.
Once you have the manifest in place, restart the kubelet so that it picks up the definition. The nodes will then start to download and run the container defined in the manifest:
$ kubernetes/cluster/kubedown.sh
Then, bring it up again using kubeup.sh as shown:
$ kubernetes/cluster/kubeup.sh
You will then need to define the resources depending on your system. If you wish to change the application label name, make sure that you also change it in the service.
Launching our pods
Now, we have to launch the pod manually. We can do this by configuring the fluentd-pod.yaml file and using the “create” command to launch the pod as follows:
$ kubectl create -f /path/to/fluentd-pod.yaml
You can now check that your pod is up and running:
$ kubectl get --namespace=kube-system pod
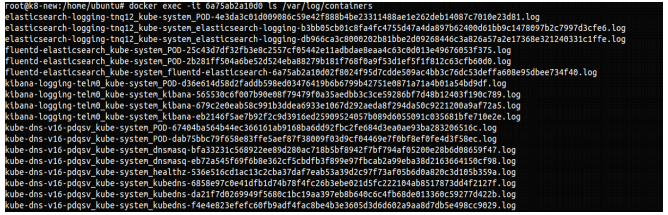
We can check the logs in the Fluentd container by executing the following command:
$ docker ps

$ docker exec -it  ls /var/log/containers
Use your container ID to see the logs inside the container:
$ docker exec -it d74372231d743 ls /var/log/containers
Streaming logs from Fluentd into Elasticsearch
Now that we have our Fluentd pods up and running, it’s time to set up the pipeline into Elasticsearch (see our complete guide to the ELK Stack to learn how to install and use Elasticsearch).
Configuring and Launching Elasticsearch as a replication controller
Since there is no need to have Elasticsearch running on each and every node, we will first launch a single instance and run it as a replication controller.
Here is the .yaml file in which our Elasticsearch instance is defined as a replication controller:
apiVersion: v1
kind: ReplicationController

metadata:
   name: Elasticsearch-logging
   namespace: kube-system
   Labels:
   k8s-app: Elasticsearch-logging
   version: v1
   kubernetes.io/cluster-service: "true"

spec:
   replicas: 1
selector:
   k8s-app: Elasticsearch-logging
   version: v1
template:
   metadata:
      labels:
         k8s-app: Elasticsearch-logging
         version: v1
         kubernetes.io/cluster-service: "true"
   spec:
      containers:
      - image: < Your es-image >
      name: Elasticsearch-logging
      ports:
         - containerPort: 9200
         name: es-port
         protocol: TCP
         - containerPort: 9300
         name: transport-port
         protocol: TCP
   volumeMounts:
      - name: es-persistent-storage
      mountPath: /data
volumes:
- name: es-persistent-storage
   emptyDir: {}
To launch the Elasticsearch replication controller, execute the following command:
$ kubectl create -f /path/to/elasticsearch-rc.yaml
We can check that the replication controller has been created and is running as expected using this:
$ kubectl get --namespace=kube-system rc

Make sure that the pod is also up and running with this command:
$ kubectl get --namespace=kube-system pod

Creating an Elasticsearch service for communicating with Fluentd
To gather the logs from the nodes in our Kubernetes cluster, we need to launch a service that will establish the communication between our Elasticsearch pod and the Fluentd pods running on the nodes.
More on the subject:
To ensure that our Fluentd pods will be able to locate the Elasticsearch instance, we are first going to use a Kubernetes service to expose an externally visible name for an endpoint. A Kubernetes service has a single IP address, a DNS scheme, and a SkyDNS add-on (the service launches automatically in the kube-system namespace when we run the kube cluster).
We can then use the container label in the Elasticsearch service definition to point to the Elasticsearch container (see the selector section in service definition below). The service will now be registered in DNS, allowing Fluentd to communicate with the Elasticsearch instance.
This following .yaml file contains the definition for the Elasticsearch service (elasticsearch-svc.yaml):
apiVersion: v1
kind: Service
metadata:
   name: Elasticsearch-logging
   namespace: kube-system
   labels:
      k8s-app: Elasticsearch-logging
      kubernetes.io/cluster-service: "true"
      kubernetes.io/name: "Elasticsearch"
spec:
   ports:
      - port: 9200
      protocol: TCP
      targetPort: es-port
selector:
   k8s-app: Elasticsearch-logging
The container kubernetes/fluentd-elasticsearch will constantly look at the containers’ log files (/var/lib/docker/containers/*) and will send the data, in Logstash format, to port 9200 on the local node.
In our case, the service specification will group all the containers that have the label k8s- app=Elasticsearch-logging together. It will also map their internal port to 9200.
Launching the Elasticsearch service
To launch the Elasticsearch service, use this command:
$ kubectl create -f /path/to/elasticsearch-rc.yaml
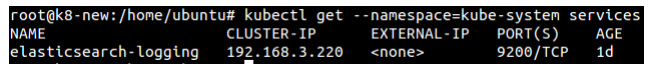
We can check that the service is up and running this way:
$ kubectl get --namespace=kube-system services
Querying the logs with Elasticsearch
With the help of the Elasticsearch service that we have launched, we can now view and query container logs.
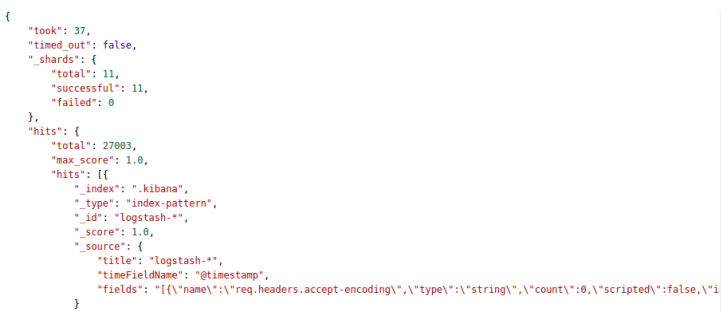
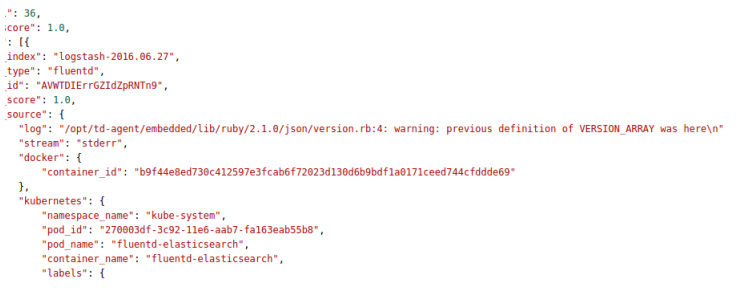
We will use the provided cluster IP address to access the Elasticsearch logs and use the ‘q=* &pretty’ search query to see web browser logs:
$ curl 192.168.3.220:9200/_search?q=* &pretty
And the output:
To search for warning messages, use the following query:
$ curl 192.168.3.220:9200/_search?q=*warning
The output:
Analyzing Kubernetes logs in Kibana
Now that we have our logs stored in Elasticsearch, the next step is to display them in Kibana. To do this, we will need to run Kibana in our cluster. Just as with Elasticsearch, we need only one Kibana instance.
Let’s set that up.
Configuring and launching Kibana as a replication controller
Launching Kibana as a replication controller ensures that at least one instance is always running in the cluster.
In ours. yaml file (kibana-rc.yaml), we need to specify the Kibana image to use for the pod:
apiVersion: v1
kind: ReplicationController
metadata:
   name: Kibana-logging
   namespace: kube-system
   labels:
      k8s-app: Kibana-logging
      kubernetes.io/cluster-service: "true"
spec:
   replicas: 1
   selector:
      k8s-app: Kibana-logging
   template:
      metadata:
         labels:
            k8s-app: Kibana-logging
            kubernetes.io/cluster-service: "true"
      spec:
         containers:
         - name: Kibana
            image: < Your kb-image >
            ports:
               - name: Kibana-port
               containerPort: 5601
To launch the Kibana replication controller, execute the following command:
$ kubectl create -f /path/to/kibana-rc.yaml
To make sure that the Kibana replication controller is up and running, use this:
$ kubectl get --namespace=kube-system rc
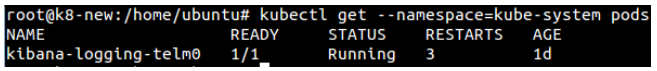
Check that the pod is running with the following command:
$ kubectl get --namespace=kube-system pod
Creating a Kibana service to communicate with Elasticsearch
To allow our pod to retrieve logs from Elasticsearch, we will need to configure a Kibana service.
In the configuration file (kibana-svc.yaml), use the default port 5601 for both the service and Kibana pod:
apiVersion: v1
kind: Service
metadata:
   name: Kibana-logging
   namespace: kube-system
   labels:
      k8s-app: Kibana-logging
      kubernetes.io/cluster-service: "true"
      kubernetes.io/name: "Kibana"
spec:
   ports:
   - port: 5601
   protocol: TCP
   targetPort: Kibana-port
selector:
   k8s-app: Kibana-logging
This service will select our Kibana pod with the help of the k8s-app: Kibana-logging label that we provided in the pod definition.
Launching and accessing Kibana
To launch the Kibana service, use this command:
$ kubectl create -f /path/to/kibana-svc.yaml
To verify that the service is up and running, use this:
$ kubectl get –namespace=kube-system services

To view and access the Kibana interface, install an NGINX web server (skip to next step if one is installed already):
$ apt-get install nginx
Change the NGINX configuration files in /etc/nginx/sites-available/default and etc/nginx/sites-enabled/default as shown here:
{
   listen 80 ;

   root /usr/share/nginx;
   index index.html index.htm;
   server_name localhost;

   location / {
      proxy_pass http://< Service-IP >:5601;
   }
}
Specify your service IP address and the port to where you want to listen. In this case, the IP address is 192.168.3.193 and listen port is 80 (default).
Now, you can start the NGINX service:
$ service nginx start
Go to your browser and enter: http://localhost:80. You should be able to see Kibana:


Logging Kubernetes Using Google Cloud
Since Kubernetes works natively with Google Cloud, users can enable cluster-level logging easily. But if we want to get the logging through Fluentd and Elasticsearch, we can set the environment variables in the configuration file for our cluster as follows (but this works only if you use GCP as your Kubernetes provider):
KUBE_ENABLE_NODE_LOGGING=true

KUBE_LOGGING_DESTINATION=Elasticsearch
Then, you can bring up and start the cluster with the following command:
$ cluster/kube-up.sh
Once the cluster is up and running, Kubernetes will launch the Fluentd and Elasticsearch pods automatically.
A Final Note
In this tutorial, we used single Elasticsearch and Kibana instances. Needless to say, this is not a scalable solution for larger environments. In a real-life scenario, a more robust and flexible logging system is required for Kubernetes logging.

You Might Also Like

10 Indispensable Amazon EKS Features and Updates You Ought to Know

The Top 5 Pitfalls of Serverless Computing and How to Overcome Them
Get started for free
Completely free for 14 days, no strings attached.
