Kubernetes 360
Full Kubernetes Observability in Minutes, powered by AI.
Gain Full Visibility into Microservices with AI for Faster Debugging and Improved Performance
Gain Full Visibility into Microservices with AI for Faster Debugging and Improved Performance
Unify all your Kubernetes data to monitor health and performance
- Full stack visibility: Centralize and visualize log, metric, and trace data from every component in your Kubernetes environment: your nodes, Control Plane, containers, and apps, together.
- Surface health and performance issues: Set alerts to automatically trigger notifications when health and performance metrics for any component cross defined thresholds.
- Ensure a reliable Control Plane: Track critical metrics – like non-200 HTTP response codes – of every Control Plane component so it can schedule and orchestrate services to keep your cluster running smoothly.
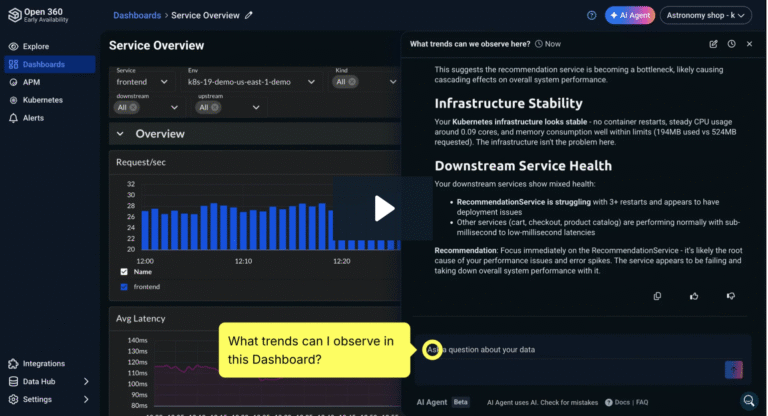
Enlist an AI Agent to investigate and troubleshoot faster
- Investigate fast: Automate analysis across logs, metrics, and traces to drill into the root cause of infrastructure issues.
- Change analysis: Understand how changes in your environment – such as new deployments and configurations – impact all your services.
- Automatically surface critical K8s errors and exceptions: Logz.io surfaces key K8s errors and exceptions based on advanced AI and machine learning.
Use cloud-native integrations to dynamically monitor orchestrated services
- Native Kubernetes integrations: Use popular open source technologies hosted by the Cloud-Native Computing Foundation to seamlessly collect K8s observability data – including OpenTelemetry, Prometheus, and Fluentd.
- Automatic service discovery in dynamic environments: Automatically collect data from newly created services, regardless of where they spin up.
- Monitor any Kubernetes platform: Including AWS EKS, Azure AKS, GCP GKE, OpenShift, Rancher, Anthos, and any other Kubernetes platform.
Use cloud-native integrations to dynamically monitor orchestrated services

Cloud and Kubernetes-scale observability
- Built on Kubernetes, for Kubernetes: Logz.io’s cloud-naive SaaS platform automatically adjusts scaling to ingest and store fluctuating volumes of data.
- Any scale, any burst, always up: Ensure your applications are highly performant and available even during unexpected spikes in traffic.
Cloud and Kubernetes-scale observability

Identify, investigate and communicate Kubernetes security issues
- Isolate security risks: Automatically scan for problematic software packages and dependencies, infrastructure-as-code issues and misconfigurations, and CVEs.
- Communicate efficiently: Inform security workflows and cross-functional communications with Kubernetes-specific intelligence that enables faster response.
- Enable a DevSecOps approach: Gain unified visibility across logs, metrics, traces and security—allowing DevOps teams to embrace end-to-end observability and troubleshooting.
Identify, investigate and communicate Kubernetes security issues

You Might Also Like
Moving to the New Open 360 AI Navigation