Logz.io vs Elastic Cloud
Zero Maintenance ELK
- Effortless maintenance and scaling: Logz.io automatically ingests any volume of observability data for storage and analysis, without requiring any manual maintenance from the customer.
- Parsing-as-a-service: Contact a Logz.io engineer through our chat bot - we will get your logs parsed in minutes.
- Consistent reliability and high performance queries: Our cloud-native architecture is designed for high performance at any scale - ensuring data reliability and optimal query performance.


We unify the best-of-breed open source for monitoring and observability tools
Elasticsearch and Kibana were designed for logs — not metrics or traces. That's why when it comes to Elastic vs. Logz.io, we provide the best-of-breed open source monitoring tools — including Prometheus for metrics, and Jaeger for traces — together on the Open360 Platform.
Drive down costs, improve MTTR with Logz.io
Noisy data in Elastic deployments needlessly drive up costs and prolong data analysis during troubleshooting. Logz.io gives customers tools and hands-on expertise to proactively identify and filter out noisy data before it reaches your dashboards and query results — reducing costs and MTTR.

Dish Network engineers were able to reduce their observability by 62% by filtering out the noise.
Happier end-users
Modern engineering teams choose Logz.io when compared to Elastic, especially for ELK Stack monitoring and observability. Here’s what our customers have to say:

Meet Requirements
Ease of Use
Ease of Setup
Ease of Admin
Quality of Support
Ease of doing business with
Would you recommend the product?
Logz.io is committed to open source

“I believe that working together on providing Elasticsearch and Kibana open-sourced, under Apache 2, is the right thing to do for our customers. It is the right thing to do for anyone who relies on these open source projects.”
Our beloved Customer Support team
“Logz.io is a great tool for analyzing logs... but the special thing is the support. Any time I had an issue, even if I needed help with regex expressions, the support chat helped me with understanding and patience, and was very fast.”

Zaken Gal
Big Data Engineer, Skai
“Our relationship with Logz.io support is extremely transparent. Tickets are always being shared and there’s always a follow up from the account manager to make sure that our issues have been taken care of.”

Manish Sejpal
DevOps Engineer, Bambora

02:30
Log Management

02:24
Infrastructure Monitoring

03:52
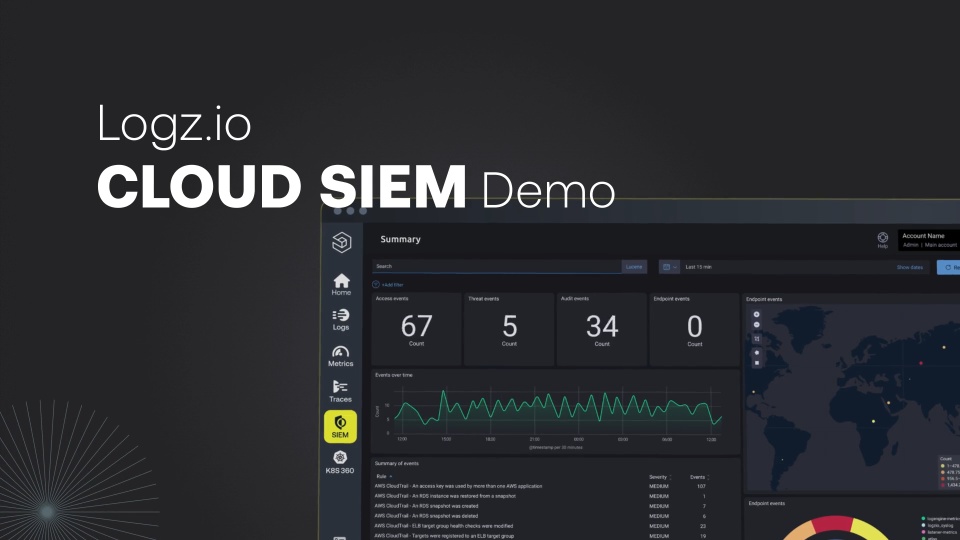
Cloud SIEM

02:12
Distributed Tracing

05:10
