How Logz.io Helps Snyk Enhance Observability in their Code


"Logz.io has been key ingredient to turning root cause analysis into a matter of a few minutes."
Customer
Snyk
Industry
Computer & Network Security
Headquarters
London, UK
Products
Log Management
Snyk protects over 120,000 developers every day from known security vulnerabilities in open source code, without slowing them down by seamlessly integrating to Dev & DevOps workflows. Snyk helps developers use open source code and stay secure by finding and fixing known vulnerabilities in open source project dependencies. It uses a comprehensive and detailed Snyk vulnerability database, maintained by a dedicated security team. Over one million packages are monitored by Snyk, protecting more than 100,000 projects written in node.js, Java, Go, Scala, Python, Ruby, .NET, PHP and Gradle.
Gaining Observability with Logz.io
Snyk deployed Logz.io to achieve end-to-end visibility into their production environment. In this video, Anton Drukh, VP of Engineering, describes how the company uses Logz.io to proactively monitor their microservices, trigger alerts around performance issues, and assert the overall validity of their environment.
Logz.io is taking the headache out of maintaining and running a very scalable Elasticsearch cluster, but still giving us all the flexibility to send in the data we want and get the most insightful feedback out of it.
More about Snyk and Logz.io: Instrumenting logging from the start
For Snyk’s engineering team, the need for a centralized logging solution was apparent from the start. Designing a microservice-based architecture, Snyk needed the ability to easily gain visibility into their services in real-time for monitoring and troubleshooting. Offering a reliable and secure Observability platform, built on the ELK Stack, Logz.io was chosen as Snyk’s weapon of choice.
Snyk’s microservices are shipping what are mainly node.js logs. These microservices are deployed on Docker containers orchestrated with Kubernetes. Container logs are shipped in JSON format to stdout, and a Fluentd daemonset is responsible for aggregating the logs from the different nodes in the cluster and forwarding them to Logz.io’s listeners.
Making logging transparent
Logging is part and parcel of Snyk’s development process. Using the Bunyan module, a logging package was developed in-house for writing node.js logs. Consistent logging standards are enforced across the organization and are taught during the onboarding and training process of new developers.
Maintaining a consistent structure in logs is a key element in these logging standards. This structure gives what is a distributed engineering team full transparency into log data. The different teams at Snyk know exactly what to expect when looking at the logs and how to interpret what actually transpired.
For example, each request handled by a server gets assigned a uuid. As the requests is processed by the different services, this ID is appended to all log messages. This helps the team trace an event across the different services for faster and more efficient troubleshooting.
Anton Drukh, VP of Engineering explains: “we get a major percentage of our support tickets with the uuid included, as we expose them to our customers when we regretfully show an error page. So the first search through the logs just takes us straight to the crime scene, no time wasted. Once we see the culprit, we can ‘unroll’ the events to the state that caused the problem in minutes by following the breadcrumbs trail shared between the dozens of services we run.”
Proactive monitoring
Snyk’s engineering team gets notified in real-time on unwanted or unexpected behavior using Logz.io’s built-in alerting engine. Using Logz.io’s Slack integration, the team is notified via Slack when specific events are taking place.
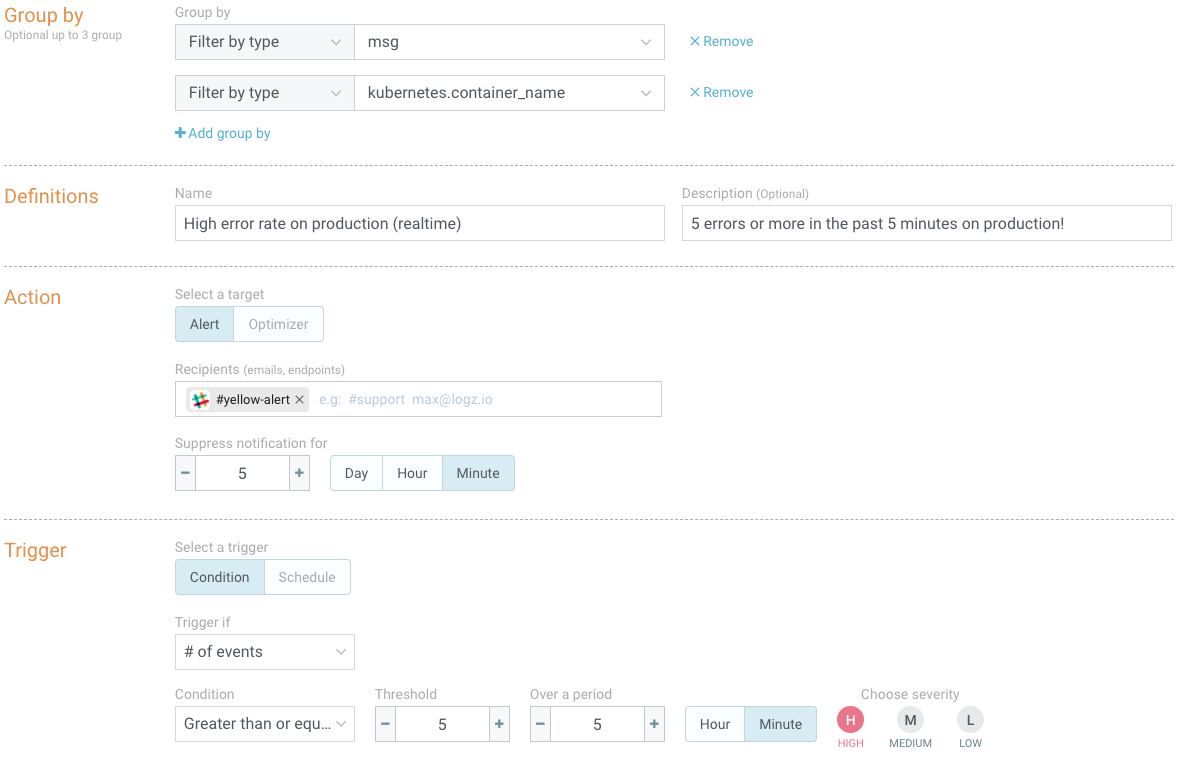
Snyk uses crawlers to search external repositories for new security vulnerabilities to add to its database. A query-based alert was created to notify the team when the crawler is misbehaving.
Alerts are also triggered if the amount of requests with 4xx and 5xx status codes exceeds normal and expected error rates. Additional alerts are configured to get notified on request rates per service, index failures and various other performance metrics.
Kibana dashboards were built for keeping an eye on the overall health of Snyk’s services in real-time, which are displayed on screens around the office. These dashboards contain a variety of visualizations that help the team closely monitor the application.
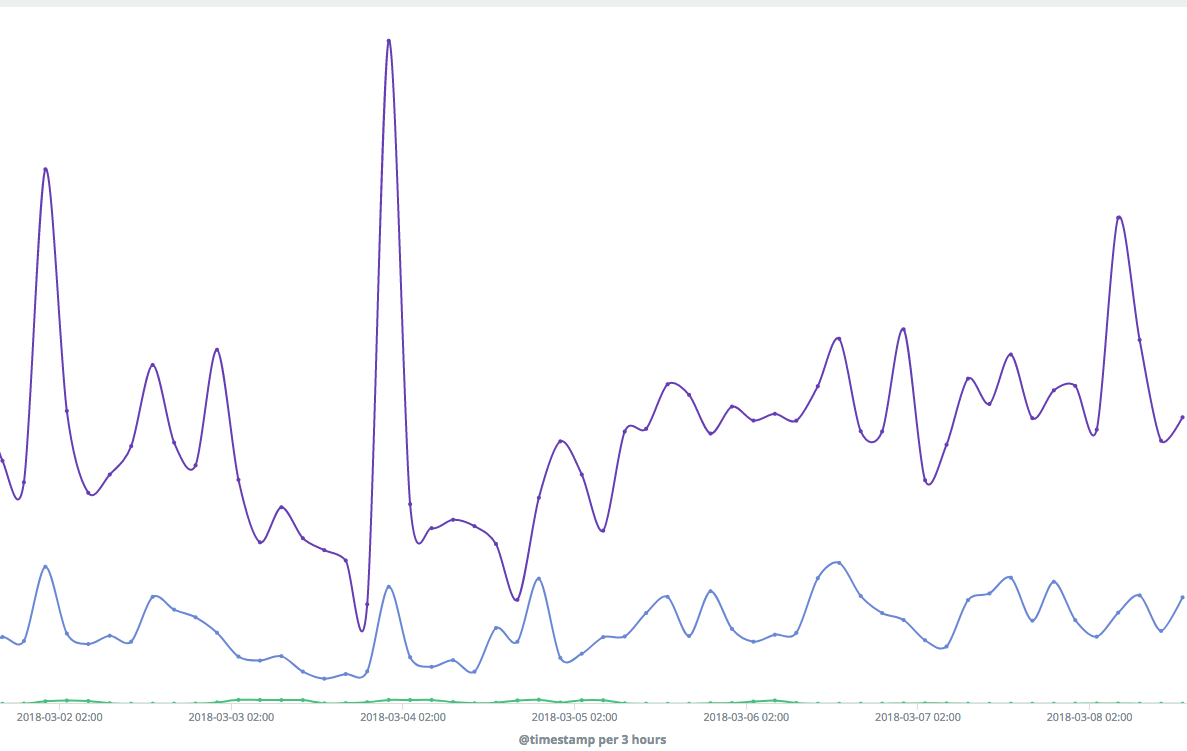
For example, a line chart visualization monitors 99th, 95th and 50th percentiles for API durations:
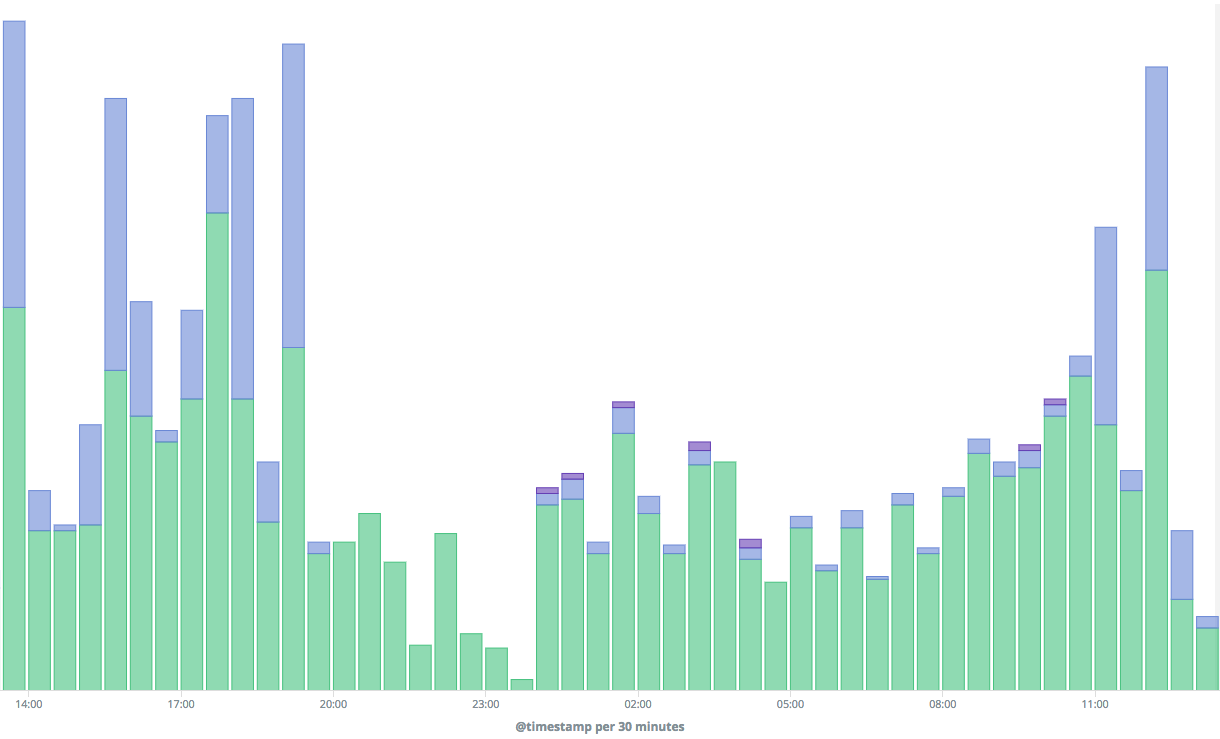
A bar chart visualization displays a historical breakdown of API responses, success, client and server errors:
Achieving full production visibility
Today, Logz.io is used by Snyk to log millions of daily requests processed by more than 50 microservices.
The combination of structured logging and using Logz.io has enabled Snyk to minimize the time it takes from identifying an issue to finding the underlying cause. The time saved is used to focus on what matters most — improving the service the company provides and driving innovation faster.
What I consider a success, is when my engineering team feels comfortable enough with logging to quickly and easily gain visibility into production issues. Logz.io has been a key ingredient in making this happen, ultimately resulting in turning root cause analysis into a matter of a few minutes.
Anton Drukh, VP of Engineering at Snyk
You Might Also Like

From Pod-Hopping to Autonomous RCA: How ThetaRay Is Rebuilding Its 24/7 NOC with Logz.io and OrionIQ