Unify Infrastructure and Application Observability with Logz.io’s Service Overview
July 13, 2023

Logz.io is excited to announce Service Overview, a fast and easy way to unify telemetry data and insights across your infrastructure and applications into a single interface. Our Beta users have reported simplified observability, faster time-to-insights, and observability consolidation.
The Business Case for Observability and Service Overview
As digital interactions increasingly define business reputations, organizations must be less tolerant of buggy features, crashing applications, slow loading times, and other poor digital experiences that can quickly drive away customers.
Those who build and maintain cloud applications bear the enormous responsibility of preventing such digital friction.
And to do so, they need to answer questions in real time about the current state of their environment, such as: why are my orders suddenly declining? What is causing this new latency in my redis server? How is my system responding to this spike in traffic?
While observability can answer these questions, it requires quickly interpreting signals and information within huge volumes of telemetry data, which are generated from hundreds or thousands of distinct and ephemeral cloud components.
While cobbling together queries, dashboards, and alerts can provide these insights, it can require hours of configuration, tweaking, and reconfiguration. Plus, all too often, these insights live in separate silos that can obstruct troubleshooting flows that require seamless analysis across different datasets.
To provide observability insights in a singular view, Logz.io is excited to announce Service Overview, which unifies the most essential telemetry data from your infrastructure and applications in a single data analysis interface – all while requiring minimal configuration.
Service Overview will serve as the beginning of your investigations.
By making it easy to spot high level performance trends across your microservices, Service Overview will point you in the right direction on your quest for the root cause of production issues.
From there, you can continuously click into specific services and transactions to further your investigation until you arrive at the telemetry data that explains exactly what is happening in your environment, and just as importantly, why your system is behaving the way that it is.
In summary, the technical case of Service Overview is to get fast insights into the current state of your microservices performance in a single place. And the business case? Deliver more performant applications to eliminate digital friction that can damage your business reputation and bottom line.
Monitoring your Microservices with Service Overview
Before analyzing our telemetry data for analysis with Service Overview, we need to collect it.
To send log, metric, and trace data to Logz.io, use our Telemetry Collector – a single agent that automatically discovers your services and collects the relevant telemetry data. It’s based on OpenTelemetry and takes just minutes to configure and deploy.
After running a single script, the Telemetry Collector will be running across your cluster sending logs, metrics, and traces to Logz.io for out-of-the-box data processing, storage, and analysis. You can automatically instrument your microservices with OpenTelemetry using Easy Connect.
Now, we’re ready to analyze the data. In the following example, we’ll see how Service Overview provides a broad overview of service performance to guide us towards the relevant details that explain the root cause of the issue.
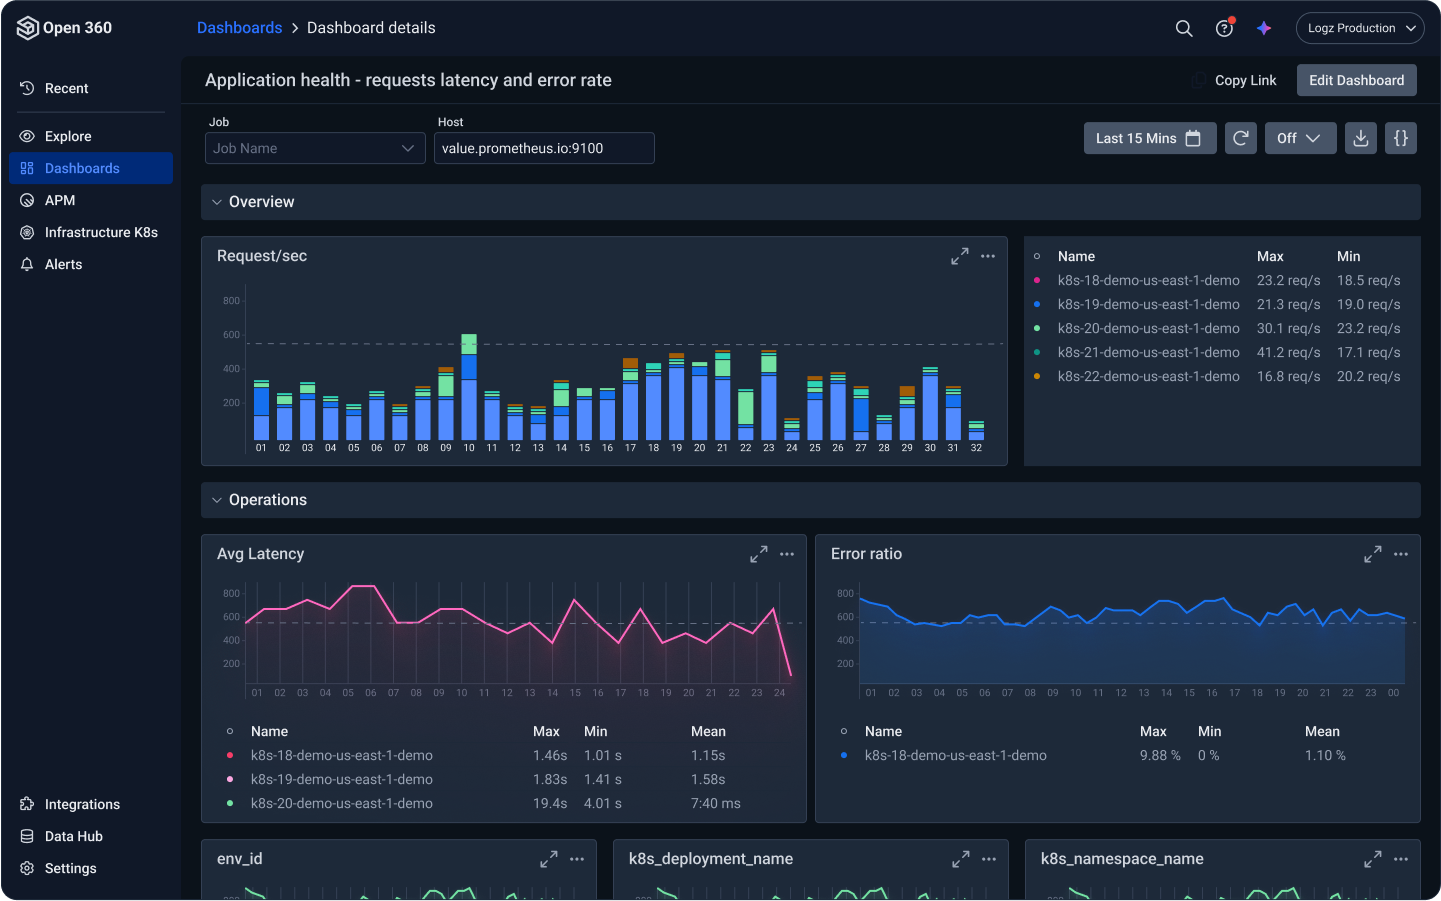
Under the ‘Traces’ tab, we can access Service Overview, which immediately provides a bird’s eye view of service performance across our environment.

After filtering for the highest error rate, we can see that the front-end service (at the top of the list in the screenshot above) is showing more errors than the rest. Lets click to investigate.

This page shows us a deeper look into our front-end health and performance. We can see the service request rate, avg latency, and error rate at the top.
In the bottom right, we can see the infrastructure usage for the service; and in the bottom left, we can monitor the performance of each operation executed by the service.
After a quick look, we can see that most of the errors are coming from the ‘POST /orders’ operation. To investigate further, we can click the operation, which brings us to Logz.io’s Distributed Tracing product.

This gives us a detailed look at the ‘Post /order’ operation within the context of the complete application request – showing the impact on downstream operations. As you can see, Distributed Tracing makes it easy to isolate latency within complex application requests spanning many microservices to identify the root cause of issues.
Service Overview served as the beginning of our investigation: making it clear where to begin looking for production issues that could be impacting customers. By clicking into specific services, we got a progressively more detailed look at application performance until we ultimately narrowed our investigation to a single application request.
How to try Service Overview
If you’re not a Logz.io user yet, start by opening a free Logz.io trial.
Whether or not you’re already a Logz.io customer, the first step to monitoring your services with Service Overview is to deploy the Logz.io Telemetry Collector on your Kubernetes cluster – just copy the instructions in the video below or in the docs.
Once your data is streaming into Logz.io, simply hit ‘Service Overview’ within the Traces tab to begin monitoring your data. You won’t need any configuration to build or maintain the data visualizations.
At this point, you can begin scanning and filtering your microservices to begin investigations into the root cause of health and performance issues across your environment.


