Announcing Kubernetes 360 Updates for Deeper Visibility into Kubernetes Performance
July 12, 2023

We’re thrilled to announce new feature updates for Logz.io’s Kubernetes 360 to provide deeper visibility and additional troubleshooting capabilities for your Kubernetes environment.
For Kubernetes 360, we’ve added the ability to select a specific deployment with filters and see it across all clusters, a Metrics tab in every resources quickview so you can see behavior over time, and log search and time range with the ability to open specific logs and view surrounding docs in the Logs tab.
Why We Created Kubernetes 360
As observability challenges mount for digital business, one particular challenge has remained constant: Kubernetes has made environments more complex, and organizations are doing their best to keep up.
Evidence of Kubernetes challenges popped up throughout Logz.io’s recent 2023 DevOps Pulse Report, based on 500 survey responses from your developer, SRE, DevOps and C-suite peers.
Almost 50% of respondents cited Kubernetes as their main challenge to gaining full observability into their environment. Roughly the same indicated Kubernetes security is the most difficult component of running the technology in production.
Additionally, some 80% of respondents highlighted that they either currently maintain or plan to implement a unified model for observability and security monitoring.
To help combat these challenges, Logz.io introduced Kubernetes 360 in fall 2022 as part of Open 360™. It’s our effort to help you unify the best of open source logging, metrics and trace analysis technologies in a single platform purpose-built for applications deployed in Kubernetes environments.
In spring 2023, we added security context enhancements to Kubernetes 360. This came via integration with Aqua Security’s open source-based Aqua Trivy vulnerability and misconfiguration scanning solution. This allows Open 360 users to quickly identify and resolve potential security issues introduced into their Kubernetes environments.
Now, after several months as part of our product offerings, we’re thrilled to share new features and updated capabilities within Kubernetes 360 intended to optimize the user experience, provide deeper visibility into performance metrics, and unlock easier ways to access helpful troubleshooting information for Kubernetes.
New Metrics Tab Showing Behavior Over Time
For Kubernetes 360, we’ve added a Metrics tab that makes it easier for users to see behavior over time and identify any potential issues.

We built this feature to provide a unified observability user experience and accelerate troubleshooting for K8s environments. Previously, users were required to toggle between different tables in order to see this information. Now, it’s all within one screen in the same interface.
Customers can use this metrics tab to dive deeper into pod performance to begin their investigations into production incidents.
Improvements to the Logs in Kubernetes 360
Within your pods in Kubernetes 360, we’ve added more information around Logs that should be helpful to users as they monitor applications.

We’ve added a search and time range function to the Logs tab. Additionally, you’ll have the ability to open specific logs and view surrounding docs for them.
Previously, Kubernetes 360 would show a list of logs, and now it’ll be much easier to discover info about them using Lucene Query Syntax. You can also get a deeper understanding of your logs by jumping into our Log Analytics product and looking at all your logs together.
New Kubernetes 360 Filters Feature
We’ve made it easier to apply filters in Kubernetes 360 and view all your clusters at once. This allows users to view only what’s needed at a given time.
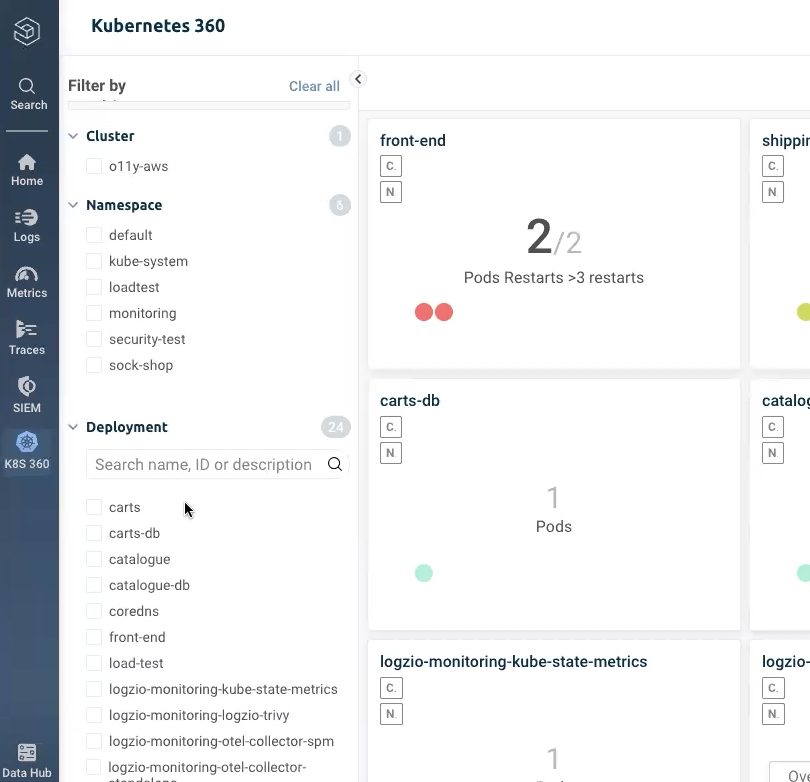
Note on the lefthand side of the screen that you’ll be able to filter your Kubernetes 360 view by Cluster, Namespace or Deployment. You’ll be able to slice and dice your data to investigate the most interesting and pertinent information across your Kubernetes clusters.
We’ve now provided an easier view for users when trying to monitor all their different services within Kubernetes 360. You’ll also be able to view data from multiple Clusters at the same time if you wish.
To learn more about Kubernetes 360 and how it can help simplify Kubernetes observability, sign up for a free trial today.

You Might Also Like

Logz.io Named Visionary in 2023 Gartner® Magic Quadrant™ for Application Performance Monitoring and Observability