Jaeger Essentials: Distributed Tracing from Dapper to Jaeger
October 14, 2020

This is a guest post from David Barda, software architect at Duda, a leading website building platform for web professionals. Duda is using Logz.io for logs management. This post was originally published on Medium.
If you are dealing with microservices, serverless architecture, on any other type of distributed architecture, you have probably heard the term “Distributed Tracing.” You may have been wondering what it’s all about, and where should you start, in this post, I’ll tell you about the journey we passed at Duda, from the day we heard about distributed tracing and started to explore whether it will be useful to use it in our company, to the exploration on what is distributed tracing all about, what are the different solutions out there, and what’s their architectures, and finally, I will present our final solution, how we instrumented our (hundred of machines) services and what we are directed to.
More on the subject:
In order to do so, I will answer the following questions:
Why would you want to even read about distributed tracing?
What is distributed tracing, where it all began, what are the core components of it?
I will also tell about our considerations at Duda, why we decided to work with specific tools and specifications, and in what way we implemented our monolith and services.
The WHY
Let’s start with the most important question — why would you even want to invest time in integrating distributed tracing into your technology stack. While there are many reasons, I’ll mention those who are the most important from my perspective.
Reveals service dependencies
The strategic decision was taken, your company started to move to a distributed architecture, the number of components starts to increase, and the ability to understand your company architecture decreases, using distributed tracing you can trace the path of a request as it travels across a complex system.
Some tools even compute and draw a full dependency graph. It can help to have an overview of your architecture and deep dive to understand dependencies better.

Discover the latency of the components along a given path
You can discover the latency by monitoring a request from the edge services using monitoring systems. OK, so you’ve got the alert, but now you need to find out what component causes the specific request to exceed the SLO. That’s exactly why distributed tracing is here for: locating components in the path that are bottlenecks or that cause failure.
Root cause analysis
Imagine the following scenario — you wake up by an alert, it’s 2 AM, and a request involving five different microservices is failing repeatedly. You’re jumping to the logs, still trying to open your eyes against your ultra-brightened screen, looking for errors around the time of the alert, but the stream of data is too big to figure out what happened., It is just taking too long. Using distributed tracing, you can find the first service that failed, get the logs from that failure, and some other stuff (depending on your tracing implementation).
Collect events during the request
In order to help in the debug process, you may add baggage to the trace. For example, at Duda, we are adding all the evaluated feature flags to the trace so that in the event of a failure, we can know exactly which flags were evaluated within each one of the services on the request path.
The WHAT
Now when we have discussed why you would even want to read the rest of this post, if you’re still with me (as I should hope, as distributed tracing is awesome!), let’s continue on to what distributed tracing is, and what different solutions you can find out there.
First, let’s start with the basics, where all the distributed tracing solutions originated from. While there were some distributed tracing solutions before, Google Dapper (2010) design paper is a, or the, cornerstone of distributed tracing. This paper explains how Google developed a production-grade tracing tool, with three key goals behind it.
- Low overhead — the tracing system should have a negligible performance impact on running services. In some highly optimized services, even small monitoring overheads are easily noticeable. For example, a single Google search query traverses thousands of machines and services, Google can’t afford a non-negligible increment to each of these requests.
- Application-level transparency — Tracing should not require active collaboration for programmers, as it may be fragile and consume programmers’ expensive time to learn it.
- Scalability — It needs to handle google’s scale for at least a few years.
They also add a requirement that the trace data will be available minutes after the request.
Service instrumentation and terminology
Dapper introduced some terminology.. It may differ between solutions, but these are the ideas are used in most of its successor solutions.
Trace: The description of a transaction as it moves through a distributed system.
Span: A named, timed operation representing a piece of the workflow. Spans accept key: value tags as well as fine-grained, timestamped, structured logs attached to the particular span instance.
(Span) Context: Trace identifying information that accompanies the distributed transaction, including when it passes the service to service over the network or through a message bus. The span context contains the trace identifier, span identifier, and any other data that the tracing system needs to propagate to the downstream service.
Instrumentation: Instrumentation is the process through which your application’s code is extended to capture and report trace spans for the operations of interest.
Annotations: annotations(sometimes called baggage), allows the developer to enrich the trace with user-defined data, it can be used to save counters, relevant logs, and whatever data can help to investigate an incident.
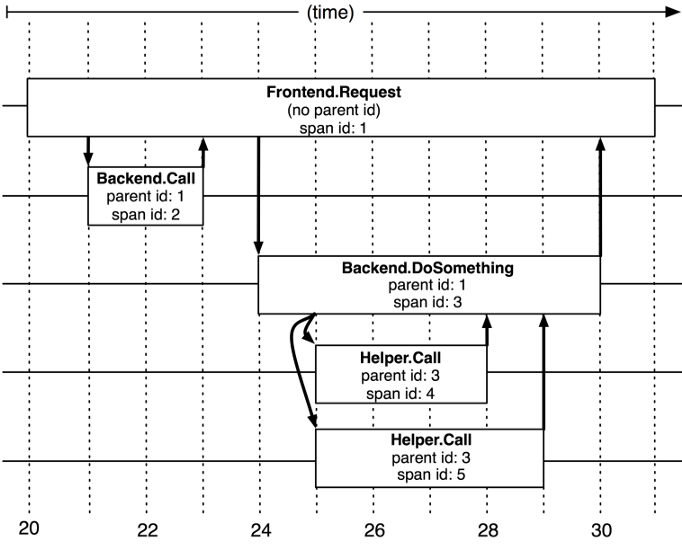
The trace context is serialized and passed during the call between instrumented services, determining if it will be an RPC, event message, SMTP, or any other communication channel you have in mind after the client sends the trace data to the server (for example by HTTP header in REST calls), the server will deserialize the span and start a new one which is pointing to its parent span, the span was received by the client.
These following images help to demonstrate the relationship between the different components:

Trace collection and storage
After the trace is collected in each instrumented server, it has to be aggregated so that the entire trace and all its spans can be shown in a single UI. The way Dapper introduced this was a three-stage process.
- Span data is written to a local log file
- Dapper collectors reading the traces from daemon on production machines
- Collectors writing the trace to a single Bigtable repository

Dapper trace collecting (Dapper a Large-Scale Distributed Systems Tracing Infrastructure, Google Technical Report Dapper 2010)
This methodology gave Google a median of 15-second latency for the collection, which is very impressive for a high scale with log overhead on the existing applications.
In order to improve the performance, sampling is being used, which means that only a fraction of all traces is being logged and collected. There is an assumption here that for most use cases, it will be enough to get all or at least most of the insights, and that performance degradation should be negligible.
The Evolution of Dapper
Now that we’ve talked about the ancestor, let’s get to the descendants available these days — many of them share the same concept or even solution as Dapper.
The solutions can be grouped into 2 groups:
- Open Source Solutions
Zipkin (Twitter)
Jaeger (Uber)
AppDash
Skywalking - Enterprise Solutions
Amazon X-Ray
Google Cloud Trace
Datadog
Lightstep
New Relic
These are some, but not all of the solutions out there. This post won’t compare them, but I’ll just say that each one of the solutions has pros and cons, and the benefits depend on your architecture, language, and (mostly) the stack. Once you chose one, to avoid coupling to a specific solution during the instrumentation, multiple specs and standards raised:
W3 specification — defines standard HTTP headers and a value format to propagate context information.
OpenTracing — OpenTracing is comprised of an API specification, frameworks, and libraries that have implemented the specification, and documentation for the project.
OpenCensus — OpenCensus is a set of libraries for various languages that allow you to collect application metrics and distributed traces, then transfer the data to a backend of your choice in real-time.
OpenTelemetry — A collaboration between the creators of OpenTracing and OpenCensus, which is created to replace them with a unified specification with instrumentation libraries written in a variety of languages. OpenTracing is now an incubating project of CNCF (Cloud Native Computing Foundation).
Implementation at Duda
Now when we have the fundamental knowledge about distributed tracing, I’d like to share with you my experience with instrumenting more than 150 machines using Jaeger and OpenTracing.
We have decided to instrument our services using OpenTracing, as back then it was the only production-ready solution (OpenCensus is in beta stages), as we have thousands of requests per second and we needed a robust solution that won’t increase the latency.
There were multiple reasons why we chose Jaeger. Firstly, it’s a mature open-source CNCF-graduated project. At the same time, we are using Logz.io at Duda as our ELK stack solution, and they’ve started to offer a distributed tracing solution with Elasticsearch store and the Jaeger UI. This integration not only diminished the operational burden of implementing the solution by ourselves but also exposed it and encouraged our developers to use the new tool, by having all the observability in a single place and by correlating each log to the relevant trace.
Our architecture at Duda is composed of a Spring framework monolith and about 10 Spring Boot microservices. For the microservices, Spring Boot starters do their magic, so all I had to do was to instrument both our internal rest-client and events shared library. In order to enable developers to know what was the exact in-service flow, I also instrumented our feature flags library so it will add the flag key and the specific value evaluated in the flow to the trace baggage. In addition to the applicative instrumentation, we ran a Jaeger agent on each machine and connected them to a collector that ship the logs to Logz.io Distributed Tracing SaaS, which took care of the ingestion, parsing, enrichment and storing in Elasticsearch, with the managed Jaeger frontend accessible from the browser for querying and visualization.
Now that you have a solid background about tracing, let’s look on an example of a Jaeger trace composed of four spans. Here, service1 is communicating with service2 using a REST call (where service1 is the client and service2 is the server), service2 evaluates a feature flag doSomthing.featureFlag.enabled with the value of true, and as a result, it produces an event that is consumed by service1. As you may note, the starting time of each subsequent span is greater than its previous. Using this information, Jaeger can calculate the time of each span and help you detect bottlenecks in your flow.

Finally, we had sessions with developers, that explained how distributed tracing works as part of our observability solution, when it should be used and how, we passed over some code examples so they will know how to instrument all the important and bottleneck-suspicious flows so we have the maximum information and minimum distractions in our trace.
That’s all for now! I hope you have a greater insight into what distributed tracing is, and why you should use it in your organization. If you have any question regarding the implementation or on the decision we took, or any idea or advice, just respond to the post!

You Might Also Like

From Alert Noise to Automated Action: The Case for Workflow-Driven Monitoring