
Can Distributed Tracing Replace Logging?
October 2, 2020

Logging has been around since programming began. We use logs to debug issues and understand how software works at the code level. After logging and debuggers, profilers are a dev’s best friend when writing code and may run in production with limits to reduce overhead. As we distributed architectures — making systems more complex — centralized log aggregation was soon necessary. At that point, we had to analyze this data. Hence, log analytics technologies were born.
More on the subject:
After logging, the application and infrastructure monitoring are the next most essential. These metrics measure how applications are behaving in real time and help engineers identify problems. Over time, we realized that these tools were not enough and more advanced profilers came forth which provided the ability to do distributed tracing and diagnostics. These three methods logging, metrics, and tracing underpin observability.
The second challenge is the understanding of what the data means. Each tool interprets data differently. The community and vendors have never created a data model to explain what the data in a log, metric, and trace describes.

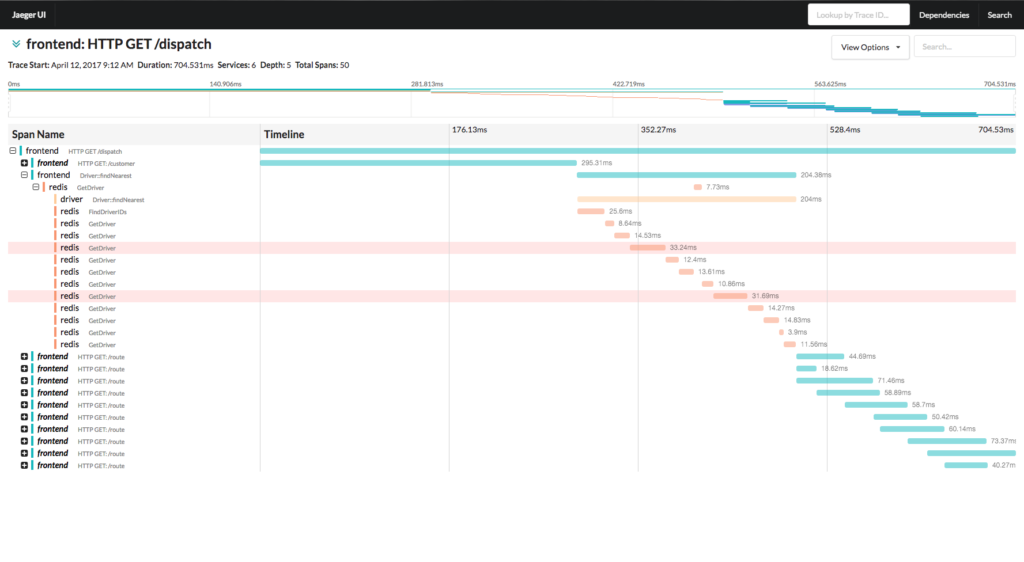
Traces and Spans (diagram from jaegertracing.io)
Standardization
Logs can contain events, statuses, metrics, and even traces. Much of this data is interchangeable and has relationships to other observability data. Each vendor and open source technology implements differing data collection, storage, and analysis strategies.
Because of this, efforts have been made and are taking hold to implement standards to commoditize the data collection. The investment and differentiation will be in storage and analysis.
We’ve recently seen New Relic open source their data collection; Datadog open sourced their data collection quite some time ago. We will see more of this across the industry as OpenTelemetry becomes the standard for data collection. The days of proprietary data collections are ending, a good thing for users.
Logging
Logging has been the biggest standardization challenge. This is due to its diverse data and the unstructured nature of the messages or events being generated by various programmers (users), vendors, and infrastructure providers. While there have been many attempts to standardize logging, they have failed to gain mass adoption. Some highlights include Arcsight’s CEF (2010) and the open-source. Apache-2.0-licensed Elastic’s ECS.

‘Count’, ‘Ratio’, and ‘Pattern” columns in Logz.io with timestamp for Log Patterns
Despite a lack of traction, we’ll likely see some or all of Elastic ECS become part of OpenTelemetry’s log format. Unfortunately, the log components of OpenTelemetry will not be part of the 2020 GA release (which focuses on metrics and traces). We should have some standards for logs in 2021, but adoption will take time and not cover many older, legacy technologies.
Tracing
Implementing tracing requires agents that instrument software either automatically or by changing code to use tracing APIs. Auto-instrumenting agents work great for Java, .NET, Python, PHP, Ruby, and other interpreted languages which run in virtual machines. The challenge is that newer languages such as Golang, Rust, and those running in platform services (PaaS) require code changes to implement tracing.
Over the past few months working with users of open source tracing, we’ve seen a pattern emerging. More companies are replacing logging with tracing. If one implements custom tracing by using libraries that require code changes, it’s simple to implement custom data. As it’s related to a trace of a specific transaction making it more valuable and a great replacement for logging.
For those who are more advanced, they can also implement the tracking of business metrics, but those should go to a metric system if possible. In some cases metric systems don’t fit and using tracing or logging may be a good choice.
To Sum Up, Point-Counterpoint
Counterpoint….
There are other discussions in the community which dictate this is not a good idea, and can cause scope creep and large traces. We have also seen this at Logz.io during our beta for Jaeger. And while this is concerning, we are confident that our Elasticsearch backend can handle the scale needs. We continue to work with these customers and determine if this will be an issue. Expect updates on Twitter, and feel free to engage with me @jkowall.
Point…
By implementing more context in traces, there are efficiency gains for developers in debugging issues. Within a single tool, the user can analyze performance, data flow, and diagnostic information without having to switch to different user interfaces. Logz.io solves this by having the tools in the same interface with links allows you to move between the Kibana and Jaeger user interfaces. It’s best to implement this in the traces to increase context and relevance. Looking forward to discussions on Twitter, feel free to reach out as I mentioned @jkowall.

You Might Also Like
Unreadable Metrics: Why You Can’t Find Anything in Your Monitoring Dashboards

