Kubernetes Monitoring: Best Practices, Methods, and Existing Solutions
Monitoring an application’s current state is one of the most effective ways to anticipate customer-impacting problems and discover bottlenecks in a production environment. Yet it is also one of the biggest challenges faced by almost all software development organizations.
While inexperience, culture, and technical background can make monitoring difficult, the complexity of modern cloud environments is usually the greatest obstacle to monitoring. When hundreds of microservices are being created, destroyed, and making calls to one another, it can be exceedingly difficult to understand what to monitor, and what monitoring signals are really telling you.
Additionally, since microservices are inherently interdependent, a subtle change in production can break the whole system. Even with excellent monitoring, cloud-native complexity can make it difficult to understand the root cause of an issue.
The technology coordinating all of these microservices is, of course, Kubernetes. While Kubernetes greatly simplifies microservice deployment and management, its fast and constant decision-making also makes it extremely difficult to know what is actually happening in production.
In the world of Kubernetes monitoring, there are so many variables to keep track of that we need new tools, new techniques, and new methods to effectively capture the data that matters. This blog will break it all down.
We’ll discuss the key Kubernetes metrics to monitor and what they tell you. We’ll also compare different Kubernetes monitoring solutions, including open source tools, proprietary tools, and Logz.io – which unifies the most popular cloud monitoring tools onto a single platform and provides full Kubernetes monitoring out-of-the-box.
Why Monitor Kubernetes Health and What Metrics Can Be Measured
Kubernetes is critical for automating microservices deployment and management. While it dramatically simplifies the process of ensuring highly available and performant microservices, it does not remove the need to monitor across your environment.
Generally speaking, there are several Kubernetes metrics to monitor. These can be separated into two main components: (1) monitoring the cluster itself, and (2) monitoring pods.
Kubernetes Cluster Monitoring
For cluster monitoring, the objective is to monitor the health of the entire Kubernetes cluster. As an administrator, we are interested in discovering if all the nodes in the cluster are working properly and at what capacity, how many applications are running on each node, and the resource utilization of the entire cluster.
Allow me to highlight some of the measurable metrics:
- Node resource utilization – there are many metrics in this area, all related to resource utilization. Network bandwidth, disk utilization, CPU, and memory utilization are examples of this. Using these metrics, one can find out whether or not to increase or decrease the number and size of nodes in the cluster.
- The number of nodes – the number of nodes available is an important metric to follow. This allows you to figure out what you are paying for (if you are using cloud providers), and to discover what the cluster is being used for.
- Running pods – the number of pods running will show you if the number of nodes available is sufficient and if they will be able to handle the entire workload in case a node fails.
An easy way to begin monitoring these metrics is with Logz.io’s Telemetry Collector and K8s 360. Telemetry Collector collects these key cluster-level metrics with a single command, and K8s 360 monitors them on prebuilt dashboards – all without requiring any configuration.
Kubernetes Pod Status Monitoring
The act of monitoring a pod can be separated into three categories: (1) Kubernetes metrics, (2) pod container metrics, and (3) application metrics.
Using Kubernetes metrics, we can monitor how a specific pod and its deployment are being handled by the orchestrator.
The following information can be monitored: the number of instances a pod has at the moment and how many were expected (if the number is low, your cluster may be out of resources), how the on-progress deployment is going (how many instances were changed from an older version to a new one), health checks, and some network data available through network services.
Container metrics are available mostly through cAdvisor and exposed by Heapster, which queries every node about the running containers. In this case, metrics like CPU, network, and memory usage compared with the maximum allowed are the highlights.
Finally, there are the application specific metrics. These metrics are developed by the application itself and are related to the business rules it addresses.
For example, a database application will probably expose metrics related to an indices’ state and statistics concerning tables and relationships. An e-commerce application would expose data concerning the number of users online and how much money the software made in the last hour, for example.
The metrics described in the latter type are commonly exposed directly by the application: if you want to keep closer track you should connect the application to a monitoring application.
Like the previous section, these metrics are collected automatically and monitored on a prebuilt dashboard with a single command using Logz.io Kubernetes Monitoring.
Metrics Collection Methods to Monitor Kubernetes
I’d like to mention two main approaches to collecting metrics from your cluster and exporting them to an external endpoint. As a guiding rule, the metric collection should be handled consistently over the entire cluster. Even if the system has nodes deployed in several places all over the world or in a hybrid cloud, the system should handle the metrics collection in the same way, with the same reliability.
Method 1 – Using Kubernetes DaemonSets
One approach to monitoring all cluster nodes is to create a special kind of Kubernetes pod called DaemonSets. Kubernetes ensures that every node created has a copy of the DaemonSet pod, which virtually enables one deployment to watch each machine in the cluster.
As nodes are destroyed, the pod is also terminated. Many monitoring solutions use the Kubernetes DaemonSet structure to deploy an agent on every cluster node. In this case, there is not a general solution — each tool will have its own software for cluster monitoring.
Method 2 – Using Heapster
Heapster, on the other hand, is a uniform platform adopted by Kubernetes to generally send monitoring metrics to a system. Heapster is a bridge between a cluster and a storage designed to collect metrics. The supported storages are listed here.
Unlike DaemonSets, Heapster acts as a normal pod and discovers every cluster node via the Kubernetes API. Using Kubelet (a tool that enables master-node communications) and Kubelet’s open-source agent cAdvisor, Kubernetes and the bridge can store all relevant information about the cluster and its containers.
A cluster can consist of thousands of nodes, and an even greater amount of pods. It is virtually impossible to observe each one on a normal basis so it is important to create multiple labels for each deployment. For example, creating a label for database intensive pods will enable the operator to identify if there is a problem with the database service.
Comparing Monitoring Solutions
Let’s take a look at five common monitoring solutions used by Kubernetes users. The first two tools (Heapster/InfluxDB/Grafana and Prometheus/Grafana) combine open source tools that are deployed inside Kubernetes. For the third option (Heapster/ELK) you can use your own ELK Stack or a hosted solution like Logz.io’s. The last option reviewed here Dynatrace) is a proprietary APM solution that provides Kubernetes monitoring.
The examples below are provided here. They use an Azure Container Service instance, but should work in any Kubernetes deployment without too many changes. As part of the testing process, a pod is deployed with a function randomly logging messages.
Inside the repository folder, just type the command below to deploy it in your Kubernetes cluster:
> kubectl create -f random-logger.yaml
Heapster, InfluxDB, and Grafana with Kubernetes
The most straightforward solution to monitor your Kubernetes cluster is by using a combination of Heapster to collect metrics, InfluxDB to store it in a time series database, and Grafana to present and aggregate the collected information.
The Heapster GIT project has the files needed to deploy this design.
Basically, as part of this solution, you’ll deploy InfluxDB and Grafana, and edit the Heapster deployment to send data to InfluxDB. Use the command
kubectl -f create
in the influxdb folder.
The following command can be used to configure Heapster to push metrics to InfluxDB:
> kubectl edit deployment/heapster --namespace=kube-system
command:
/heapster
--source=kubernetes.summary_api:””
--sink=influxdb:http://monitoring-influxdb.kube-system.svc:8086
After deploying all the pods, you should be able to proxy Kubernetes, and access Grafana (kubectl proxy command).
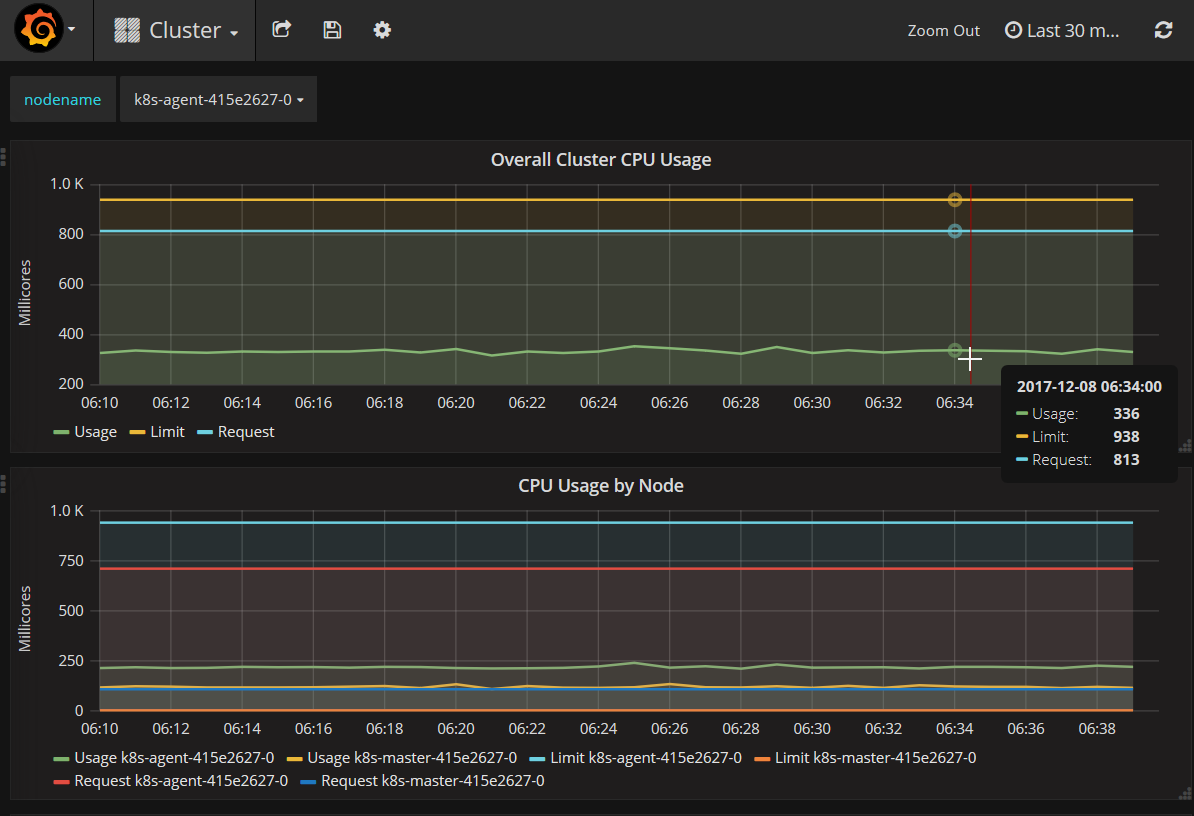
By default, Grafana will show you two dashboards, one for cluster monitoring:
The other for and other for pod monitoring:
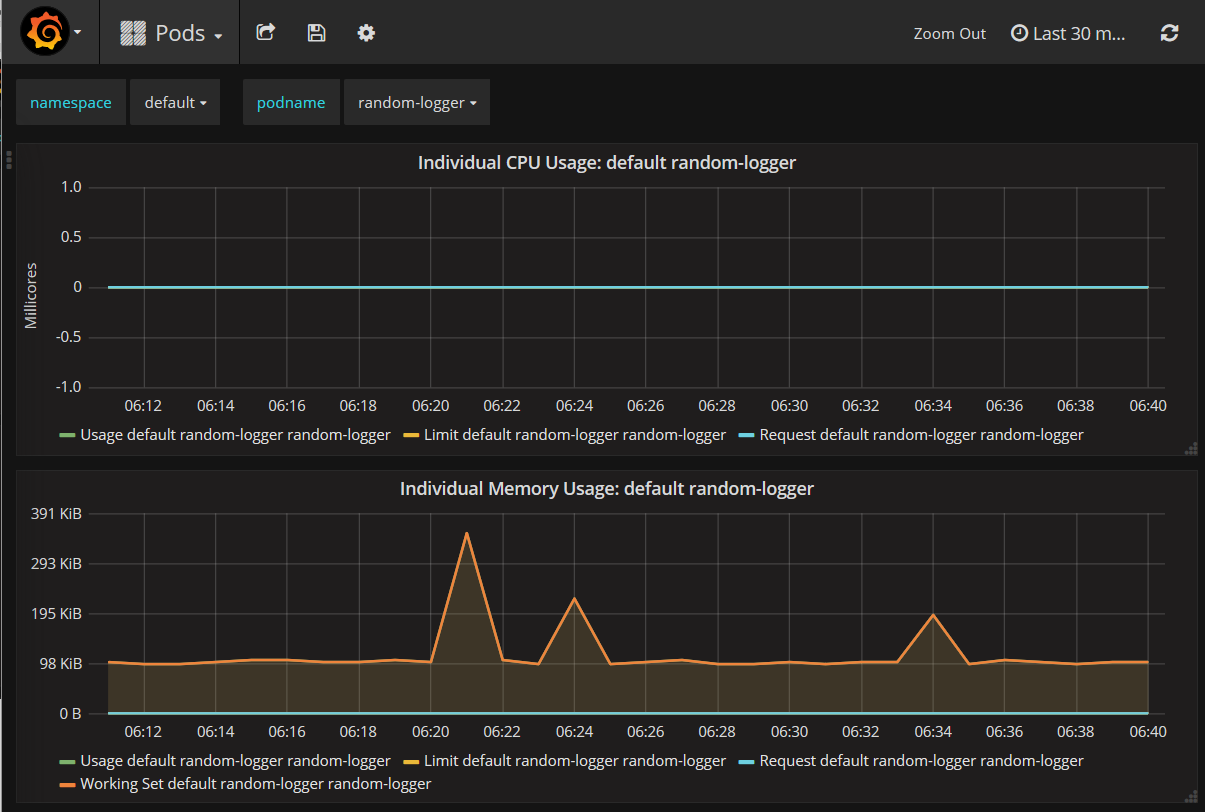
Grafana is an extremely flexible tool and you can combine several metrics into a useful dashboard for yourself. In the example above, we captured the metrics provided by Kubernetes and Docker (via cAdvisor). They are generic metrics that every node and every pod will have, but you can also add specific metrics for applications.
You can see our more in-depth tutorial on using Grafana and InfluxDB to monitor Kubernetes.
Prometheus and Grafana with Kubernetes
Prometheus is another popular solution for collecting Kubernetes metrics, with several tools, frameworks, and API’s available for using it.
Since Prometheus does not have a Heapster sink, you can use InfluxDB and Prometheus together for the same Grafana instance, collecting different metrics, whenever each one is easier to collect.
In our repository, you just need to deploy Prometheus to start collecting data:
> kubectl create -f prometheus/prometheus.yml
Then, you can use the same Grafana instance by adding a new datasource to it. You can see our more in-depth tutorial on using Prometheus with Grafana.
Heapster and ELK Stack with Kubernetes
The ELK Stack is a combination of three components: Elasticsearch, Logstash, and Kibana, each responsible for a different stage in the data pipeline. ELK is a widely used for centralized logging to troubleshoot production issues. While ELK is still popular, AWS forked the ELK Stack in 2021 after Elastic closed sourced Elasticsearch and Kibana – the forked version is called OpenSearch.
There are various methods of hooking in ELK with our Kubernetes. One method, for example, uses deploys fluentd as a DaemonSet. In the example below, however, we will simply create an Elasticsearch sink for Heapster.
First, in the elk folder in our repository, run the files with:
> kubect create -f .
Elasticsearch and Kibana will be automatically configured.
Next, we need to add it as a Heapster sink. To do this, simply edit the heapster file as follows:
> kubectl edit deployment/heapster --namespace=kube-system

      - command:
        - /heapster
        - --source=kubernetes:https://kubernetes.default
        - --sink=influxdb:http://monitoring-influxdb.kube-system.svc:8086
        - --sink=elasticsearch:http://elasticsearch-logging:9200
Heapster will begin to send metrics to InfluxDB and Elasticsearch, and an Elasticsearch index with the heapster–YYYYMMDD format will be created.
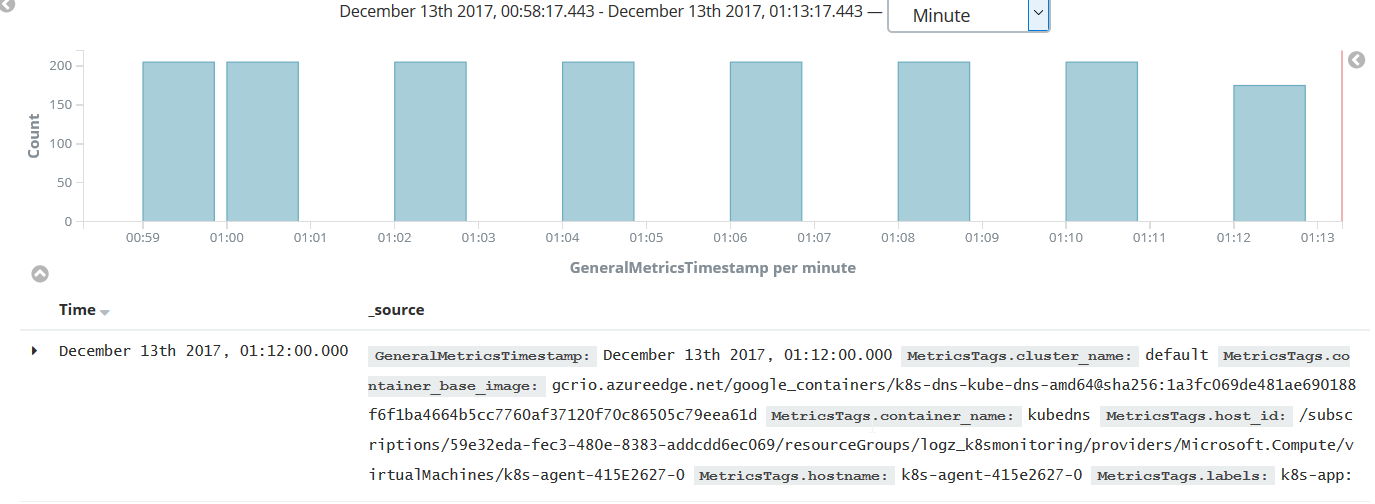
To analyze the data in Kibana, first retrieve its external address:
> kubectl get service kibana-logging -n kube-system
Use the external IP with port 5601 to access the Kibana index configuration:
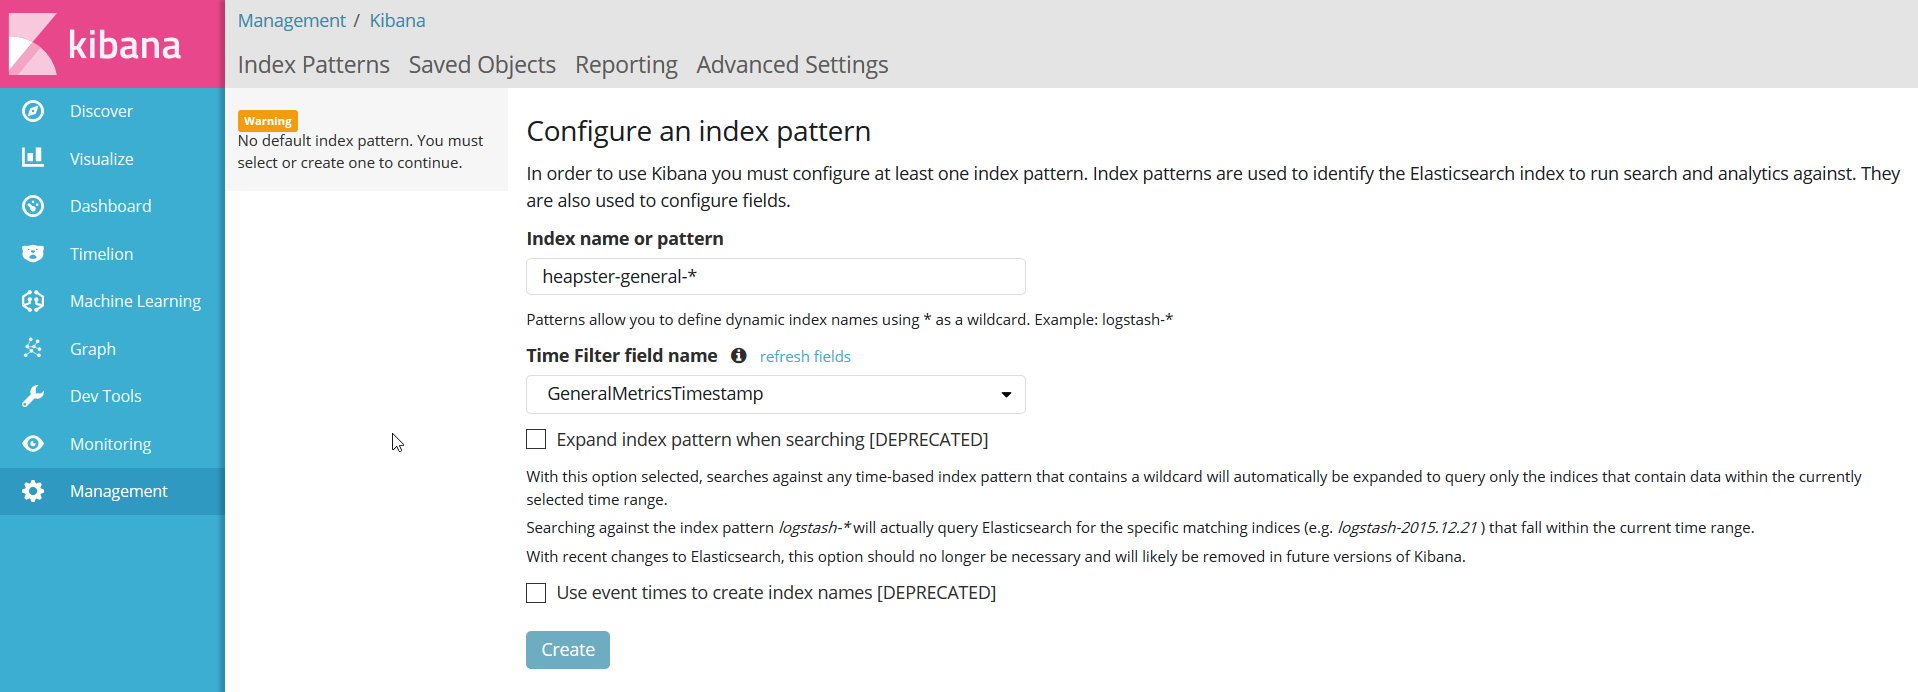
Define the index patterns in Kibana, and you should be able to see the metrics flowing.
Needless to say, the example above is an overly simple Elasticsearch instance that is not designed for scalability and high availability. And if you are monitoring a cluster, you should also consider not storing the data inside the same cluster as this will affect computed metrics, and you will not be able to investigate issues in case the cluster is down. For a fully scalable OpenSearch (new forked version of the ELK Stack) that doesn’t require any maintenance, try Logz.io, which delivers open source based log, metric, and trace analysis out-of-the-box.
Metricbeat is another ELK monitoring solution that is worth mentioning and will be reviewed in a future post. This solution involves installing Metricbeat on each monitored server to send metrics to Elasticsearch. A Kubernetes module for Metricbeat is still in the beta phase, but you can already use this shipper to monitor your cluster, nodes, and pods.
Logz.io
As mentioned earlier, Logz.io unifies and enhances the most popular open source tools to monitor Kubernetes – including Prometheus, OpenSearch, and OpenTelemetry – on a single platform.
In addition to having a single-pane-of-glass for observability, Logz.io builds additional capabilities on top of the open source like AI to troubleshoot faster, alerting, data optimization to reduce costs, and RBAC. Learn about the way Logz.io unifies and enhances the leading open source observability technologies here.
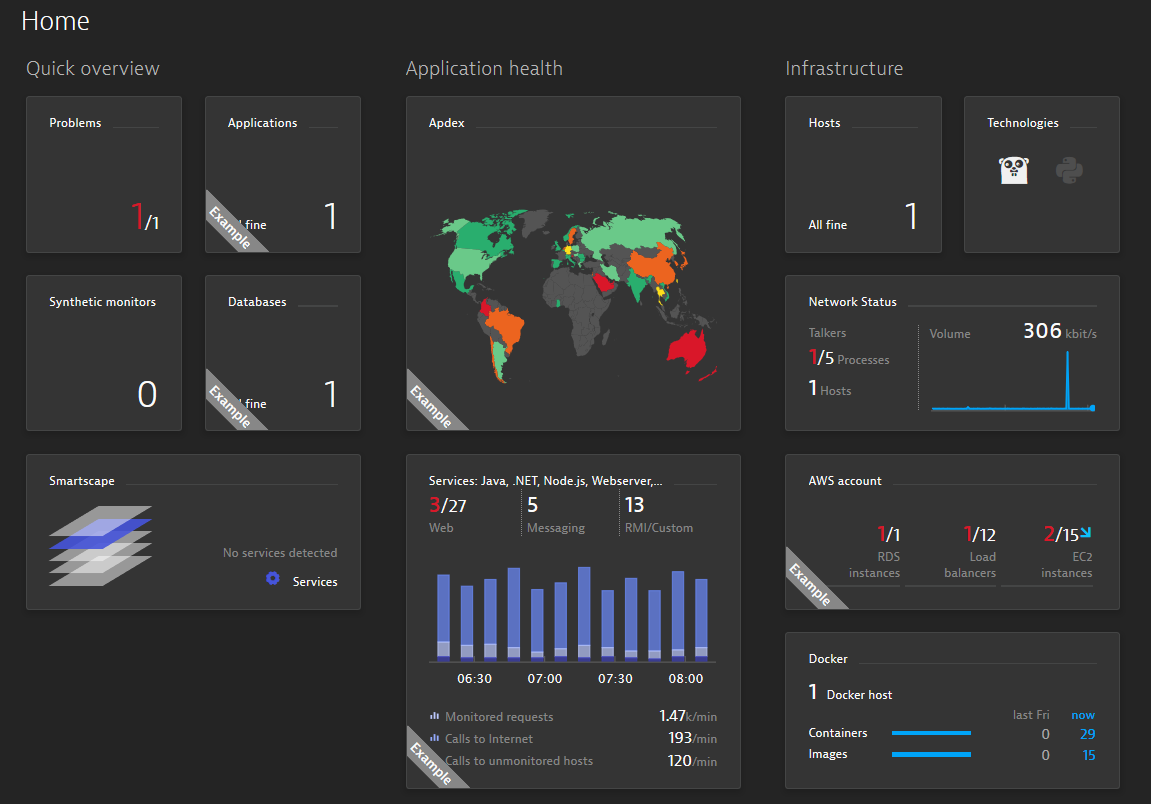
The result is full observability at a fraction of the cost of traditional solutions. The screenshot below shows Logz.io’s out-of-the-box Kubernetes data visualization and correlation using K8s 360. See a short demonstration to see how to begin collecting and visualizing Kubernetes monitoring data quickly with Logz.io.

Dynatrace
Dynatrace is another APM solution that provides an agent that will run as a DaemonSet in your cluster. The steps to have a Dynatrace agent deployed are less straightforward since you have to collect data from more than one page until you have a proper deployment file.
Once you have the file deployed using
Kubect create -f deployment-file.yml
you’ll have metrics flowing to Dynatrace in a few minutes.
Dynatrace does not distinguish between a simple Linux host and Kubernetes nodes, so you can’t expect some useful Kubernetes metrics exposed by default like with Datadog.
Here is an example of the Dynatrace dashboard:
Endnotes
Deadlines, inexperience, culture, technical background, and management are just some of the obstacles that can affect how successful teams are at implementing effective monitoring and observability.
But at the end of the day, the growing complexity of cloud-native environment is what makes monitoring and logging so difficult these days. As mentioned above, monitoring Kubernetes is one step, but to have a comprehensive view you will need to monitor the applications themselves as well. No one said it was going to be easy!
In this article, we’ve explained the importance of monitoring for a distributed system and reviewed the different types of metrics available and how to use them with different technologies.
What technology you end up using, whether open source solutions or a proprietary SaaS solution, will depend of course on your needs, the level of expertise of your engineers, and of course, your budget.
To get started monitoring your Kubernetes log, metric, and trace data, try Logz.io’s free trial for simple and fast telemetry data collection and visualization – all at a fraction of the cost of traditional solutions.