Jaeger Essentials: Performance Blitz with Jaeger

I’d like to share some of the best practices we’ve learned on our journey to battle performance issues with the Jaeger tracing tool. Among other topics, I’ll cover:
- Typical investigation cases
- Trace patterns you should be looking out for
- How to use filtering by duration to focus investigation
- Instrumentation and how to prioritize it
- How to correlate logs and traces
If you’re short on reading time—feel free to skip the examples and jump straight to the summary part.
Performance Issues Ahead
Some may say we are experts in logging. We log for a living, and have our log analytics service (which we based on open source ELK Stack) to prove it. We’ve mastered logging to the level where debugging and troubleshooting our system is a no-brainer. This is the case even though it’s a multi-cloud, multi-region, multi-tenant, and high-scale system.
And then came the performance issues.
Our service handles thousands of requests per minute, with a tremendous amount of internal server communications. Recently, we had a decrease in our UI performance. We had noticed the app started to load a little slower, and many requests took longer to respond. With my team is responsible for application infrastructure and Node.js-related microservices, we began to investigate the performance issues.
Being experts in logs, we did what we know best and started there.
When Logs aren’t Enough
Logs are great, But in our case, they turned out not to be that helpful.
The first issue we faced was that logs produce tons of identical data. But secondly and more importantly, we had a random decreasing performance issue in different flows on our application.
These included first app load and various XHR requests (XMLHttpRequest asynchronous data requests from the browser to the server). It was hard to point to one thing in particular, and even harder to connect the problem to a specific service.
The request sequences were incredibly long, so it was tough to get details from logs. We tried to force our logs to act as spans by attaching a request ID to each log so we could somehow trace through the logs. However, it was painful to visualize Jaeger traces using Kibana.
What we really had to see was communication between services. So, we needed better visualization options to track a request and analyze it better.
Installing Jaeger and Instrumenting our Microservices
As a result, we started to look into tracing solutions in order to give us a better picture of all the paths a request can go through. As we are strong FOSS advocates, we started by looking for open source solutions that would be well recognizable and have excellent community involvement.
The two leading OSS tracing projects are Zipkin and Jaeger. Between them, we settled on Jaeger, which Uber engineers developed and later contributed to the CNCF, over Zipkin.
In fact, Jaeger graduated from the CNCF incubation just this past October.
Another major advantage for Jaeger is that the Jaeger Collector can also accept spans in Zipkin format (JSON v1/v2 and Thrift), so when we integrate with systems or frameworks that expose Zipkin-based instrumentation, we could visualize and analyze those frameworks with Jaeger UI as well.
Instrumentation
Based on OpenTracing and jaeger-client-node, we instrumented all our Node.js HTTP layer with tracing, as well as with the Node.js frameworks we use—Hapi/express (an interesting topic we’ll discuss in a future post, so stay tuned!), and started shipping data to our Jaeger platform. Disclaimer: we will soon release our own distributed tracing in Beta as a managed service basing itself on Jaeger.
The first time I opened the Jaeger UI, I was excited and amazed as I had never experienced such visibility into our services before.
Even in the pilot phase with only two instrumented services, it was amazing to see each sequence and the communication between them right in front of me. For example, our main microservice was making many decisions in line with each incoming request. I never really understood when and why, until I saw a couple of traces.
Today, whenever I have to talk about our microservices architecture and explain a request flow, I first present it on the Jaeger UI. It shows live data, so the people who see it feel much more connected.
Personally, I don’t need to maintain a sequence diagram anymore and update it every couple of weeks. Jaeger shows our live sequence, and is always up-to-date.
Investigating our System Performance with Jaeger Tracing
Let’s get back to the performance issues that drove us here. The first glance of the UI immediately gave away two major issues that have long been in our code but eluded us until now.
The Serial Call, a.k.a. “Staircase”
I was shocked that I had never noticed this before. It was such an obvious staircase pattern that from day one should never have been there. This pattern indicates a serial call sequence. But in our system, there was no real need for it to be sequential. We could easily make things run concurrently to reduce overall latency. We went and made this change in no time, resulting in a significant application performance improvement.
The Bad Query, a.k.a. “Span Spike”
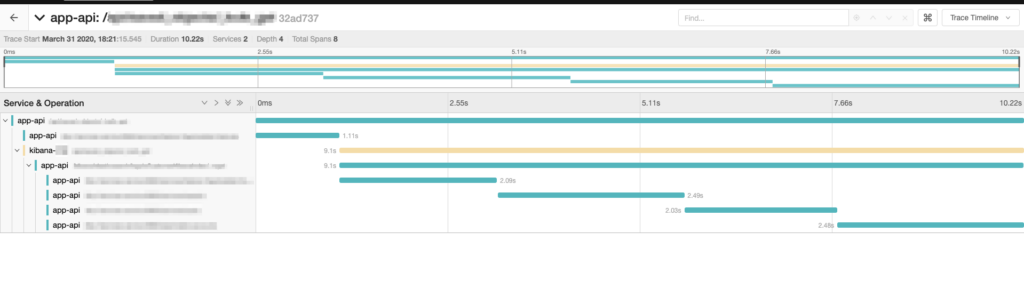
The next step was to filter results according to the minimum execution duration, which brought up another performance issue. We saw one request that fetched user data with significantly varying duration, ranging between 100 milliseconds to nearly 10 seconds. This request executes from the browser and had to finish before we could render the screen to the user. As a result, loading took several seconds, something unacceptable for UX.

This request triggers concurrent requests to fetch all the relevant user data from various endpoints, where each of those requests goes through several other microservices.
Instrumenting Microservices
As we were in the beginning of our journey in tracing instrumentation, we lacked instrumentation on some downstream microservices for full trace view. But there is a workaround until we have the missing instrumentation. Whenever our API fetches data from other microservices, we instrument those requests as well. That way, we encapsulate a number of un-instrumented services and present them as one span within our trace.
With that instrumentation in place, it was easy to investigate and find the chain of services that was at the root of the problem. With the help of our backend developers, we investigated this specific request.We found one key that is read for some user requests which was mistakenly not cached. This triggered a call to the database to retrieve it, causing the latency only on the calls requiring this particular key.
This finding even surprised the backend developer in charge of this data layer. I really find it hard to imagine how we would have found it without tracing pointing us in the right direction.
Making Tracing Part of the Routine
After investigating these first performance issues, we started using Jaeger as a standard investigation tool.
We also found that combining Jaeger tracing with logs gave us a major boost. In the past, whenever I investigated such a problem, I would start from a single microservice log. Then, I would tediously search each and every microservice along the request sequence.
Now whenever I encounter an error in the logs, I switch to the Jaeger tracing UI and look for all the related microservices to that request. It saves me a lot of time, and it helps me see things I haven’t seen before.
Correlating Logs and Traces
In order to correlate between a span/trace in Jaeger and a group of logs, we follow the pattern I mentioned above. We attach a request ID field to every log and add it as a tag to each span.
Here’s a great example of such flow in action from a recent incident. We had suddenly suffered something that seemed like a DDoS attack where requests flooded one endpoint. In turn, this caused one of the downstream microservices to overload and go into a restart loop.
After getting that endpoint’s log, we used the Jaeger UI to understand the effect it had on our services, the amount of requests to that endpoint and the duration each time that endpoint was called.
Using the request ID, it was easy to switch back to one of the logs that correlated with the problematic span. That log gave us details about a specific open session that turned out to be the root cause of the problem. When we closed the problematic session, that decreased the lag on our platform and returned the system to normal state.
Useful Tips
Jaeger is a must-have tool for us and for any large scale distributed system. Distributed tracing helps us better understand our system flows and sequences, improve our system performance, and effectively investigate issues.
Some useful tips and best practices worth considering:
- Correlate Traces and Logs: Logs together with traces are extremely powerful. Throw metrics into the mix and you’ll get the best tool set available to investigate a problem. Just don’t forget that you need to implement some sort of an ID (such as our Request ID) to each log in order to correlate it to a trace.
- Prioritize Instrumentation: Getting going with tracing is a gradual process. So don’t try to instrument every part of your system from day one. Prioritize the critical services where you need observability the most, and grow the coverage over time. In the meantime, consider encapsulating the trace of un-instrumented downstream services. Do this by creating a span in line with outgoing requests.
- Filtering by Duration: Use the minimum duration filtering to hone in on problematic traces you need to look into.
Common Patterns
Here are some patterns to look for when inspecting your traces in Jaeger:
- Staircase: often indicates a sequence of serial calls. You may want to check if you can parallelize that flow to reduce overall latency. This can be either due to implementation code or misconfiguration (e.g. of thread pool)
- Span Spike: long spans, especially ones that vary tremendously between executions, may indicate slow queries, caching issues or similar issues
- Gap between Spans: can indicate of slow inter-service communication, or a service missing instrumentation
- Spans Finishing at the Same Time: may indicate some artificial constraint like timeout or locking issues.
Summary
We are still at the beginning of our journey with distributed tracing. We continue our efforts to instrument additional parts of the system and its platforms, and improve our adoption across the different engineering teams. With the proper instrumentation, we could nail our issues even faster.
We are also working to improve our Jaeger and its collaboration with our logging and telemetry, to get more complete observability into our system. So far, all the switching between logs and traces had to be done manually, copying and pasting the context from one to the other. However, we’ve recently started integrating the tools together to provide the ability to hop between Kibana and the Jaeger UI and vice versa, just as Logz.io enables for metric-log correlation.
With that in place, searching logs for errors will be a matter of a click. Kibana will bring you to the Jaeger UI with the trace visualizing the error, or one click from a span to its respective logs.
We can’t wait for this cross-tool correlation to be available, and I’m sure most of the developers will find it handy as well. We’ll soon be launching it in beta, so if you find it interesting, keep an eye out.
You Might Also Like

Beyond Logs, Metrics and Traces

DevOps Pulse Survey 2019: Spotlight on Observability
Get started for free
Completely free for 14 days, no strings attached.