How to Use ELK to Monitor Performance

Very often, when I was troubleshooting performance issues, I saw a service that is or a couple of machines that are slowed down and reaching high-CPU utilization. This might mean that it lacks resources because of high load, but very often it means that there is a bug in the code, an exception, or an error flow that over-utilizes resources. To find that out, I had to jump between New Relic/Nagios and the ELK Stack.
So, I decided that I wanted to have one pane-of-glass to view performance metrics combined with all the events generated by the apps, operating systems, and network devices.
In order to use ELK to monitor your platform’s performance, a couple of tools and integrations are needed. Probes are required to run on each host to collect various system performance metrics. Then, the data needs to be shipped to Logstash, stored and aggregated in Elasticsearch, and then turned into Kibana graphs. Ultimately, software service operations teams use these graphs to present their results. In this article, I will share how we built our ELK stack to monitor our own service performance.
1. Collecting and Shipping
Collection
In the first stage of collecting and shipping data to Logstash, we used a tool called Collectl. This cool open-source project comes with a great number of options that allow operations to measure various metrics from multiple different IT systems and save the data for later analysis. We used it to generate, track, and save metrics such as network throughput, CPU Disk IO Wait %, free memory, and idle CPU (indicating overuse/underuse of computing resources). It can also be used to monitor other system resources such as inode use and open sockets.
Collectl command example:

Finally, Collectl outputs metrics into a log file in plot format. This open-source, live project knows how to gather information but does not automatically ship it to the ELK stack.
This second Collectl example displays nfs activity, along with memory usage and interrupts.
collectl -sjmf -oT

#         <-------Int--------><-----------Memory-----------><------NFS Totals------>
#Time     Cpu0 Cpu1 Cpu2 Cpu3 Free Buff Cach Inac Slab  Map  Reads Writes Meta Comm
01:47:52   999   55    0    0   2G 201M 600M 360M 199M 106M      0      0    5    0
01:47:53  1001 1355    0    0   2G 201M   1G 978M 233M 106M      0  10701    0    2
01:47:54  1000 7618    0    0   1G 201M   1G   1G 212M 106M      0  20202    0    2
collectl -sn –verbose -oT
# NETWORK SUMMARY (/sec)
#          KBIn  PktIn SizeIn  MultI   CmpI  ErrIn  KBOut PktOut  SizeO   CmpO ErrOut
08:46:35   3255  41000     81      0      0      0 112015  78837   1454      0      0
Using a Docker Container
We encapsulated Collectl in a Docker container in order to have a Docker image that basically covered all of our data collecting and shipping needs. We used Collectl version 4.0.0 and made the following configurations to avoid a couple of issues:
— In order to avoid data overflow within the container, we only keep data collected from the current day. Longer data retention periods are maintained by virtue of the ELK stack itself so you don’t need to worry about keeping all of the data in the container’s log file.
— Collectl can collect various samples at a specified interval but will dump output to a disk on a different interval. This is called a flush interval. As this is the closest speed to real-time that you can achieve, data needs to be flushed every second. A 30-second collection interval, for example, is quite an aggressive sampling interval that may not be necessary for every use case. An output formatter is used to output a plot format, which has various values on the same line with a space delimiter.
The Collectl configuration file should look something like this:
DaemonCommands = -f /var/log/collectl/performance-tab -r00:00,0 -F1 -s+YZ -oz -P --interval 30
PQuery =   /usr/sbin/perfquery:/usr/bin/perfquery:/usr/local/ofed/bin/perfquery
PCounter = /usr/mellanox/bin/get_pcounter
VStat =    /usr/mellanox/bin/vstat:/usr/bin/vstat
OfedInfo = /usr/bin/ofed_info:/usr/local/ofed/bin/ofed_info
Resize=/usr/bin/resize:/usr/X11R6/bin/resize
Ipmitool =  /usr/bin/ipmitool:/usr/local/bin/ipmitool:/opt/hptc/sbin/ipmitool
IpmiCache = /var/run/collectl-ipmicache
IpmiTypes = fan,temp,current
Using RSYSLOG
RSYSLOG is another component of the container. It comes into play in the form of picking up data from the log file and shipping it to the ELK stack. In order for Logstash to only perform grokking on the necessary fields instead of on everything, it is advisable to add a bit more metadata to the log selected using RSYSLOG. This can be done by taking the metrics just before shipping and adding more information such as the instance name and host IP. Along with the proper time stamp, this information can be sent to Logstash.
Small Gotchas
At this stage, there are two issues that require some attention:
1 – Timestamp: First of all, Collectl doesn’t output in its time stamp of the collected data. Therefore, if you are running hosts in various time zones, they won’t be aligned properly in your ELK. In order to hack this problem, we query the time zone the container is running in and set the timestamp accordingly.
2 – Follow the Collectl log filename: The other complication is that Collectl outputs the data into a file, but the name doesn’t remain constant. Only the filename prefix is customizable, and Collectl automatically appends the current date. The issue is that RSYSLOG is unable to follow this file if the name changes from day-to-day. A way around this is to use the latest version of RSYSLOG — version 8, which I assume most users are not yet utilizing. We created a short script with the older version that runs in cron inside the container and links a specific constant name to the ever-changing data collection name. RSYSLOG is then able to pick up that name despite the fact that it is a link to a target that changes daily. It’s like a pointer that moves to whatever the Collectl log filename is at any moment.
$ModLoad imfile
$InputFilePollInterval 10
$PrivDropToGroup adm
$WorkDirectory /var/spool/rsyslog

# Logengine access file:
$InputFileName /var/log/collectl/daily.log
$InputFileTag performance-tab:
$InputFileStateFile stat-performance
$InputFileSeverity info
$InputFilePersistStateInterval 20000
$InputRunFileMonitor

$template logzioPerformanceFormat,"[XXLOGZTOKENXX] <%pri%>%protocol-version% %timestamp:::date-rfc3339% XXHOSTNAMEXX %app-name% %procid% %msgid% [type=performance-tab instance=XXINSTANCTIDXX] XXOFSETXX %msg% XXUSERTAGXX\n"
if $programname == 'performance-tab' then @@XXLISTENERXX;logzioPerformanceFormat
Container Checklist
— Collectl
— RSYSLOG
— Collectl output file link rotation script
— crontab config for rotation script
The docker image can be pulled from DockerHub at this link: https://registry.hub.docker.com/u/logzio/logzio-perfagent/
2. Parsing the Data
After the collection and shipping stages come data parsing. Collectl returns unstructured log data, which is basically a series of numbers that are fed into the Logstash Grok expression in order to get each field name and specific values.
Collectl configuration parameters explicitly set a specific output pattern. The RSYSLOG log configuration adds the time zone in a specific place in a shipped message. If you are using these two configurations together the Grok pattern that you need is:
%{GREEDYDATA:zone_time} %{NUMBER:cpu__user_percent:int} %{NUMBER:cpu__nice_percent:int}
%{NUMBER:cpu__sys_percent:int} %{NUMBER:cpu__wait_percent:int} %{NUMBER:cpu__irq_percent:int}
%{NUMBER:cpu__soft_percent:int} %{NUMBER:cpu__steal_percent:int}
%{NUMBER:cpu__idle_percent:int} %{NUMBER:cpu__totl_percent:int}
%{NUMBER:cpu__guest_percent:int} %{NUMBER:cpu__guestN_percent:int}
%{NUMBER:cpu__intrpt_sec:int} %{NUMBER:cpu__ctx_sec:int} %{NUMBER:cpu__proc_sec:int}
%{NUMBER:cpu__proc__queue:int} %{NUMBER:cpu__proc__run:int} %{NUMBER:cpu__load__avg1:float}
%{NUMBER:cpu__load__avg5:float} %{NUMBER:cpu__load__avg15:float} %{NUMBER:cpu__run_tot:int}
%{NUMBER:cpu__blk_tot:int} %{NUMBER:mem__tot:int} %{NUMBER:mem__used:int}
%{NUMBER:mem__free:int} %{NUMBER:mem__shared:int} %{NUMBER:mem__buf:int}
%{NUMBER:mem__cached:int} %{NUMBER:mem__slab:int} %{NUMBER:mem__map:int}
%{NUMBER:mem__anon:int} %{NUMBER:mem__commit:int} %{NUMBER:mem__locked:int}
%{NUMBER:mem__swap__tot:int} %{NUMBER:mem__swap__used:int} %{NUMBER:mem__swap__free:int}
%{NUMBER:mem__swap__in:int} %{NUMBER:mem__swap__out:int} %{NUMBER:mem__dirty:int}
%{NUMBER:mem__clean:int} %{NUMBER:mem__laundry:int} %{NUMBER:mem__inactive:int}
%{NUMBER:mem__page__in:int} %{NUMBER:mem__page__out:int} %{NUMBER:mem__page__faults:int}
%{NUMBER:mem__page__maj_faults:int} %{NUMBER:mem__huge__total:int}
%{NUMBER:mem__huge__free:int} %{NUMBER:mem__huge__reserved:int}
%{NUMBER:mem__s_unreclaim:int} %{NUMBER:sock__used:int} %{NUMBER:sock__tcp:int}
%{NUMBER:sock__orph:int} %{NUMBER:sock__tw:int} %{NUMBER:sock__alloc:int}
%{NUMBER:sock__mem:int} %{NUMBER:sock__udp:int} %{NUMBER:sock__raw:int}
%{NUMBER:sock__frag:int} %{NUMBER:sock__frag_mem:int} %{NUMBER:net__rx_pkt_tot:int}
%{NUMBER:net__tx_pkt_tot:int} %{NUMBER:net__rx_kb_tot:int} %{NUMBER:net__tx_kb_tot:int}
%{NUMBER:net__rx_cmp_tot:int} %{NUMBER:net__rx_mlt_tot:int} %{NUMBER:net__tx_cmp_tot:int}
%{NUMBER:net__rx_errs_tot:int} %{NUMBER:net__tx_errs_tot:int} %{NUMBER:dsk__read__tot:int}
%{NUMBER:dsk__write__tot:int} %{NUMBER:dsk__ops__tot:int} %{NUMBER:dsk__read__kb_tot:int}
%{NUMBER:dsk__write__kb_tot:int} %{NUMBER:dsk__kb__tot:int} %{NUMBER:dsk__read__mrg_tot:int} %{NUMBER:dsk__write__mrg_tot:int} %{NUMBER:dsk__mrg__tot:int} %{NUMBER:inode__numDentry:int} %{NUMBER:inode__openfiles:int} %{NUMBER:inode__max_file_percent:int}
%{NUMBER:inode__used:int} %{NUMBER:nfs__reads_s:int} %{NUMBER:nfs__writes_s:int}
%{NUMBER:nfs__meta_s:int} %{NUMBER:nfs__commit_s:int} %{NUMBER:nfs__udp:int}
%{NUMBER:nfs__tcp:int} %{NUMBER:nfs__tcp_conn:int} %{NUMBER:nfs__bad_auth:int}
%{NUMBER:nfs__bad_client:int} %{NUMBER:nfs__reads_c:int} %{NUMBER:nfs__writes_c:int}
%{NUMBER:nfs__meta_c:int} %{NUMBER:nfs__commit_c:int} %{NUMBER:nfs__retrans:int}
%{NUMBER:nfs__authref:int} %{NUMBER:tcp__ip_err:int} %{NUMBER:tcp__tcp_err:int}
%{NUMBER:tcp__udp_err:int} %{NUMBER:tcp__icmp_err:int} %{NUMBER:tcp__loss:int}
%{NUMBER:tcp__f_trans:int} %{NUMBER:buddy__page_1:int} %{NUMBER:buddy__page_2:int}
%{NUMBER:buddy__page_4:int} %{NUMBER:buddy__page_8:int} %{NUMBER:buddy__page_16:int}
%{NUMBER:buddy__page_32:int} %{NUMBER:buddy__page_64:int} %{NUMBER:buddy__page_128:int}
%{NUMBER:buddy__page_256:int} %{NUMBER:buddy__page_512:int} %{NUMBER:buddy__page_1024:int}?(
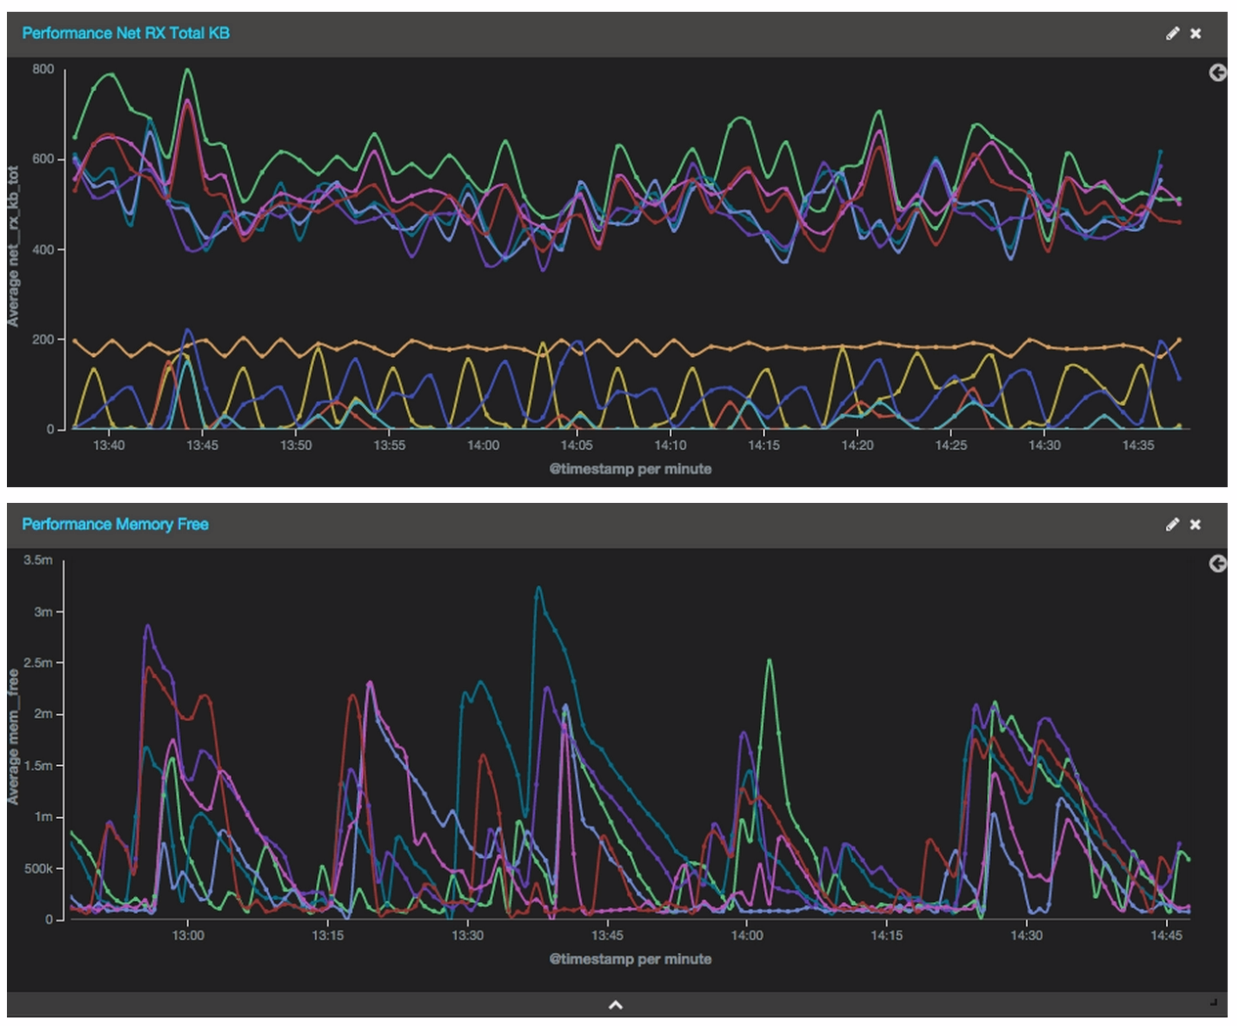
%{GREEDYDATA:user_tag})3. Visualization
If you have a fast ELK stack, you will get the information almost immediately. Obviously this depends on the performance of your ELK, but you can expect results in half a minute or less, giving you a very up to date stream of information.
At Logz.io, we have several pre-built alerts and dashboards for performance metrics using Collectl. If you’re using the Logz.io service, feel free to drop us a line on the chat box and we’ll share them with you.
If you’d like to learn more, feel free to leave a comment below!