
Improving DevOps Performance with DORA Metrics

Everyone in the software industry is in a race to become more agile. We all want to improve the performance of our software development lifecycle (SLDC). But how do you actually do that? If you want to improve your performance, first determine what KPI you’d like to improve.
DORA metrics offer a good set of KPIs to track and improve. It started as a research by the DevOps Research and Assessment (DORA) and Google Cloud (which later acquired DORA), to understand what makes high performing teams. It was comprehensive research that spanned thousands of organizations and tens of thousands of people.
In 2018, the team published the results and conclusions in the famous “Accelerate book” (or in its full lengthy name: Accelerate: The Science of Lean Software and DevOps: Building and Scaling High Performing Technology Organizations). Since then, DORA carried on surveying and updating periodically, the latest being the State of DevOps 2021 report.
In their comprehensive research, the team has identified four key metrics indicating the performance of a software development team – the DORA Metrics:
- Deployment Frequency – How often an organization successfully releases to production
- Lead Time for Changes (Cycle Time) – The amount of time it takes a commit to get into production.
- Change Failure Rate – The percentage of deployments causing a failure in production
- Mean Time to Recovery (MTTR) – How long it takes an organization to recover from a failure in production
The report also provides for each DORA metric its value ranges for Elite/High/Medium/Low performers of that metric to serve as an industry benchmark.
Let’s look into each of the DORA metrics and see what it’s about, which aspects it helps improve and how to measure it, as well as benchmark figures.
Deployment Frequency
The third principle in the Agile Manifesto talks about “Deliver working software frequently.” Let’s measure how well we do that. Deployment Frequency measures how often an organization successfully releases to production.
Massive releases are hazardous to this high frequency goal. To help this velocity, keep your releases small and focused, as it will make it easier to review and will be quicker to debug as issues arise.
There are other common inhibitors to frequency, such as needing to wait for specific employees with the permission to deploy, or lack of testing automation. Make sure your release pipeline is as smooth and as automated as possible and reduce unnecessary bottlenecks.

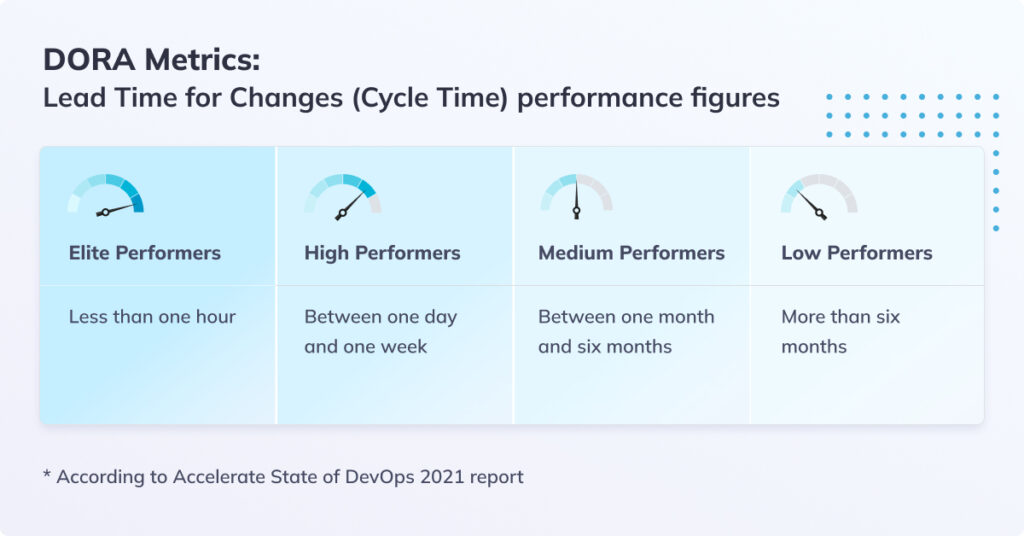
Lead Time for Changes (Cycle Time)
Lead Time for Changes, sometimes also called Cycle Time, measures the amount of time it takes a commit to get into production. This includes everything from the first commit to deployment, with all the testing, build, and CI/CD pipeline on the way.
There are multiple contributors to long lead time for change: it could be an overly long time for code to be reviewed or for a PR to be approved, it could be requirements that change in the midst of development, or flaky CI/CD pipelines with poor observability to troubleshoot.
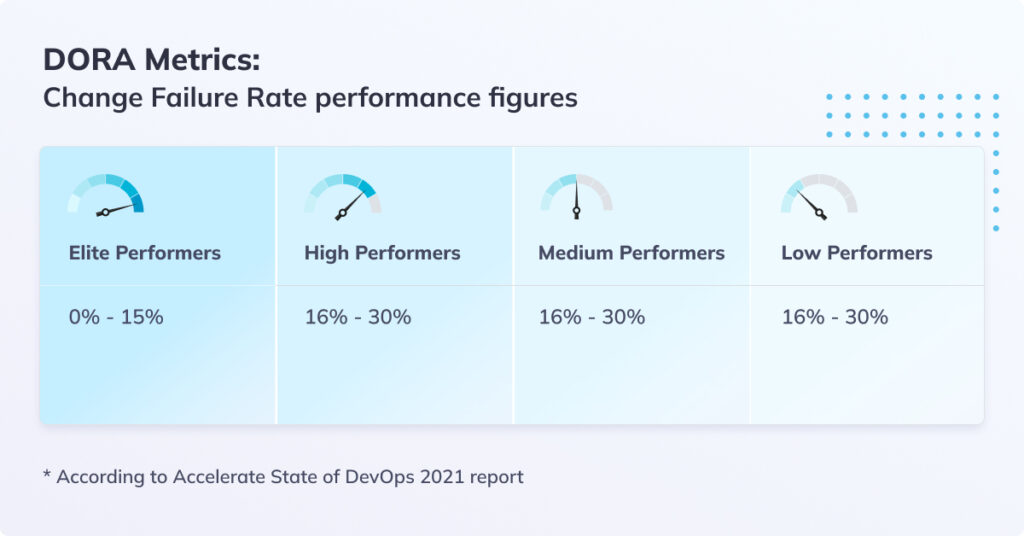
Change Failure Rate
Change Failure Rate measures the percentage of deployments causing a failure in production. We want to reduce this rate of faulty deployments as much as possible, as each such cycle of deployment and then remediation via rollback or a fix is very time-consuming and can also impact the level of service that our users experience.
Unlike point faulty deployment, high change failure rate over time typically indicates a systematic problem. It could be insufficient test coverage, staging or pre-production environments that don’t adequately simulate the production environment, or a lacking code review discipline. Nothing here is new to developers, but the Change Failure Rate makes the aggregated bottom line impact measurable and trackable.
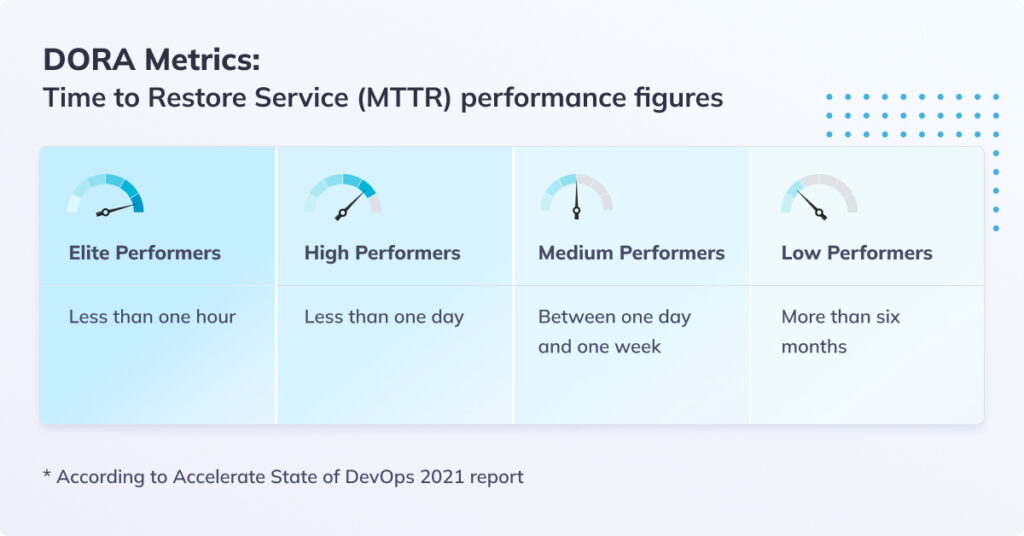
Mean Time to Recovery (MTTR)
Mean Time to Recovery (MTTR), which the DORA research refers to as Time to Restore Service, measures how long it takes an organization to recover from a failure in production.
We’ve all seen the results of major outages at AWS or other high profile services can cause, both in terms of direct financial loss, not to mention the impacted brand reputation. This is the reason quick recovery is essential.
Fail Fast is the way to go, but it’s not so easy to achieve. Long mean time to recovery can be the result of lack of accessible runbooks and incident management processes, or insufficient observability to investigate and pinpoint the error. Automation is also key here to enable quick alerting, remediation and rollback as applicable.
Also make sure that when your system goes down, your observability system doesn’t go down with it – just see the example of AWS status page going down during the recent outage. And the other pattern, where the status page shows all green during outage isn’t that much better either.
Balancing the DORA Metrics
As we’ve seen, it’s hardly trivial to optimize each one of the individual metrics of the DORA model. It becomes even less trivial when you try to optimize several metrics in parallel. In fact, you may run into conflicting interests. For example, you may want to increase our Deployment Frequency, but the increased frequency can result in an increase of the Change Failure Rate.
It is the proverbial wedge between Dev and Ops: Dev want speed, while Ops want stability. In DevOps we own both responsibilities, and need to balance the concerns of speed and stability in our SDLC requirements.
Speed is governed by the Lead Time for Change and Deployment Frequency DORA metrics.
Stability is governed by Mean Time to Delivery and Change Failure Rate DORA metrics.
If you find yourself optimizing on both speed and stability, you need to carefully consider the priorities of your optimization and the goal figures. One approach is to break it down to phases, in a divide-and-conquer fashion, where each phase focuses on just one metric. If you need to tackle both at the same phase, consider bringing the different relevant teams together and creating joint procedures to address both concerns.
Go ahead and explore the DORA Metrics in your own system, and see how you stack up against industry standards and most importantly – against your team’s and organization’s goals.
You Might Also Like

Logz.io Now Supports AWS App Runner
Java garbage collection logging with the ELK Stack and Logz.io
Get started for free
Completely free for 14 days, no strings attached.