Apache Tomcat Monitoring with ELK and Logz.io

Apache Tomcat is the most popular application server for serving Java applications. Widely-used, mature and well documented, Tomcat can probably be defined as the de-facto industry standard. Some sources put Tomcat’s market share at over 60%!
Tomcat is particularly popular for serving smaller applications since it doesn’t require the full Java EE platform. It consumes a relatively small amount of resources and provides users with simpler admin features.
Tomcat is not a web server like Apache or Nginx but is defined as a Java servlet container, or a web container that provides extended functionality for interacting with Java Servlets. But just like Apache and Nginx, Tomcat serves requests and as such provides access logs for monitoring traffic. In this article, we’ll show how to collect, process and analyze these logs using the ELK Stack and Logz.io.
To follow the steps outlined here, you’ll need your own ELK Stack or a Logz.io account.
Tomcat logging 101
Tomcat provides a number of log types that can be used for monitoring Tomcat performance and the requests it serves:
- Catalina log – records information about events such as the startup and shutdown of the Tomcat application server
- Catalina.out – uncaught exceptions and thread dumps
- Access log – records HTTP transactions between the client and the application server
As explained above, in this article we will focus on one specific type — access logs. These contain important information on the requests served by Tomcat, including the IP address of the client sending the request, the request method and URL path, the HTTP status code, the number of bytes returned to the client and more.
Step 1: Installing Tomcat
If you’ve already got Tomcat installed, great. Just skip to the next section. If you haven’t, below are instructions for installing the server on an Ubuntu 16.04 machine. Note, we’re also installing tomcat8-docs, tomcat8-examples, and tomcat8-admin which provide web apps with docs, tests, and admin features for Tomcat.
sudo apt-get update

sudo apt-get install tomcat8
sudo apt-get install tomcat8-docs tomcat8-examples tomcat8-admin
sudo systemctl start tomcat8
As a side note, OpenJDK will be installed as a dependency when you install the tomcat8 package which will also help us when installing Logstash.
Step 2: Shipping to ELK
There are a number of ways you could ship the Tomcat access logs to the ELK Stack. You could use Logstash as the collector, processor and forwarder. If you have multiple Tomcat servers, however, a better method would be to use Filebeat as a collector on each host, and a single Logstash instance for aggregating the logs, processing them and forwarding them into Elasticsearch.
Installing and configuring Filebeat
First, and if you haven’t already, download and install the Elastic signing key:
wget -qO - https://artifacts.elastic.co/GPG-KEY-elasticsearch | sudo
apt-key add -
Then, save the repository definition:
echo "deb https://artifacts.elastic.co/packages/7.x/apt stable main" | sudo tee -a
/etc/apt/sources.list.d/elastic-7.x.list
To install Filebeat, use:
sudo apt-get update
sudo apt-get install filebeat
Next, configure Filebeat to collect the Tomcat access log file and forward it to Logstash for processing:
sudo vim /etc/filebeat/filebeat.yml
filebeat.inputs:
- type: log
  enabled: true
  paths:
    - /var/log/tomcat8/localhost_access_log.*.txt

output.logstash:
  hosts: ["localhost:5044"]
Installing and configuring Logstash
Our next part of the pipeline is Logstash. Java should already be installed if you’re running Tomcat, so simply run:
sudo apt-get install logstash
sudo apt-get install logstash:
sudo vim /etc/logstash/conf.d/tomcat8.conf
In this file, we will use the beats input plugin, a number of filter plugins to process the data including the geoip filter plugin for adding geographic data to the logs, and the Elasticsearch output plugin:
input {
  beats {
    port => 5044

}

filter {
    grok {
      match => { "message" => "%{COMBINEDAPACHELOG}" }

    date {
      match => [ "timestamp" , "dd/MMM/yyyy:HH:mm:ss Z" ]

    geoip {
      source => "clientip"

}

output {
  elasticsearch {
    hosts => ["localhost:9200"]

}
We can now start the pipeline with:
sudo service logstash start
sudo service filebeat start
Within a minute or two, you should see a new Logstash index in Elasticsearch…
curl -X GET "localhost:9200/_cat/indices?v"

health status index                      uuid                   pri rep docs.count docs.deleted store.size pri.store.size
green  open   .kibana_task_manager       8cIOckjdQr-Kz8oYoyWEZg   1   0          2            0     45.5kb         45.5kb
green  open   .kibana_1                  upsj6c9GRl6B5eU7MNvLBg   1   0          5            0     29.9kb         29.9kb
yellow open   logstash-2019.06.17-000001 hDgkiPbqRw6x5OpdZT-qtg   1   1         45            0      159kb          159kb
You can then define the “logstash-*” index pattern in Kibana under Management → Kibana → Index Patterns. Once defined, you’ll be able to start analyzing the Tomcat access logs on the Discover page:

Shipping to Logz.io
Since Tomcat access logs are identical to Apache access logs, shipping them into Logz.io is super simple. Logz.io provides automatic parsing, so all you need to do is install and configure Filebeat.
First, though, execute the following 3 commands to download and copy the required SSL certificate:
wget https://raw.githubusercontent.com/logzio/public-certificates/master/COMODORSADomainValidationSecureServerCA.crt
sudo mkdir -p /etc/pki/tls/certs
sudo cp COMODORSADomainValidationSecureServerCA.crt /etc/pki/tls/certs/
Next, we need to edit the Filebeat configuration file. You can configure this file manually if you like, but Logz.io provides a wizard for generating it automatically. Under Log Shipping, open the Filebeat section, and click the button to open the wizard.
Fill in the fields as follows:

Note the type which is defined as Apache Access logs — this will ensure the Tomcat logs are processed and parsed properly.
Create the file and copy it into the /etc/filebeat folder, overriding the existing configuration file.
Starting Filebeat, you’ll see the Tomcat logs in Logz.io appear within a minute or two:

Step 3: Searching Tomcat logs
Kibana is a great tool for diving into logs and offers users a wide variety of search methods when troubleshooting. Recent improvement to the search experience in Kibana, including new filtering and auto-completion, make querying your logs an easy and intuitive experience.
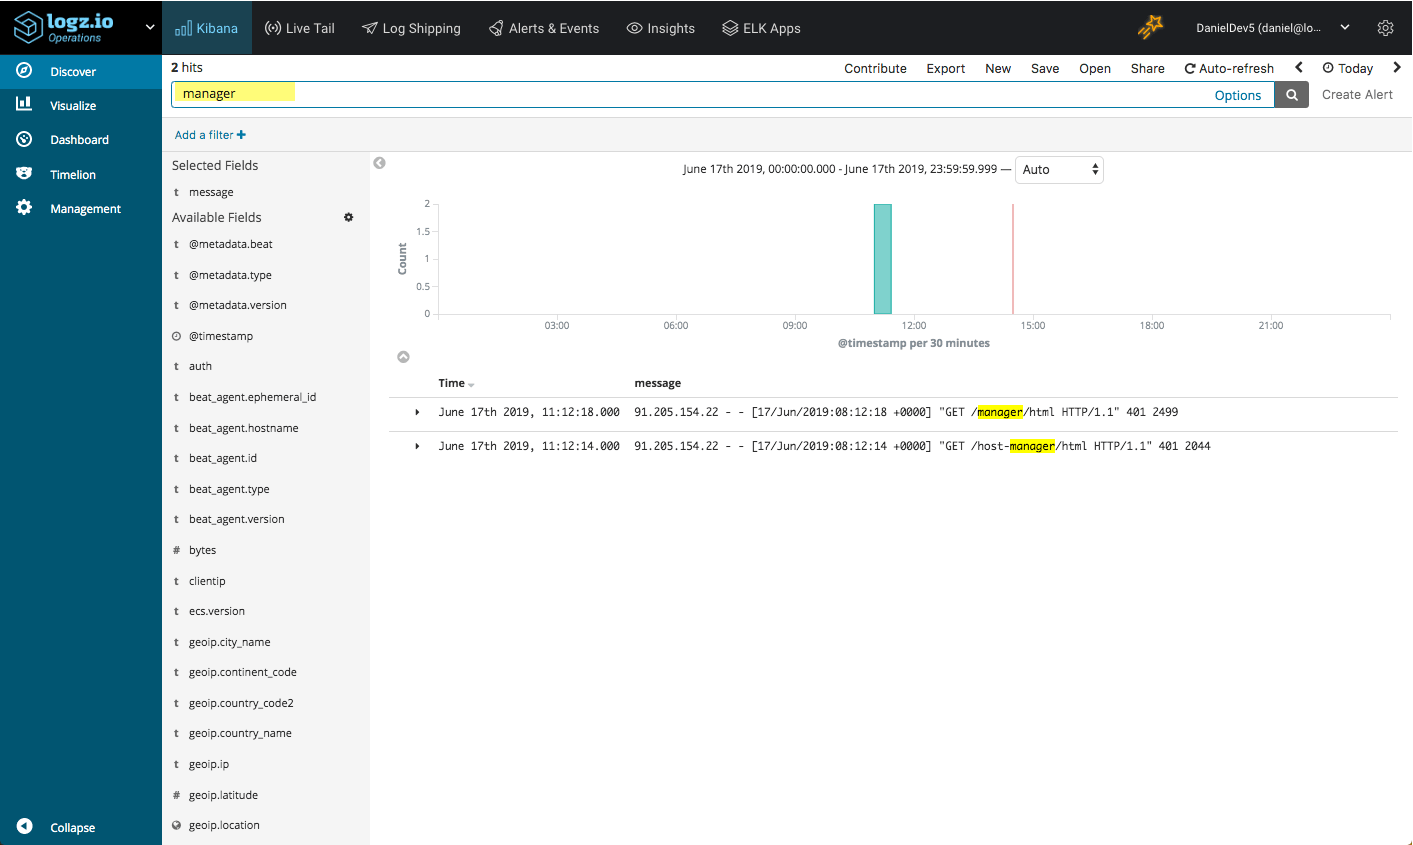
Starting with the basics, you can enter a free text search for a specific URL called by a request:
manager
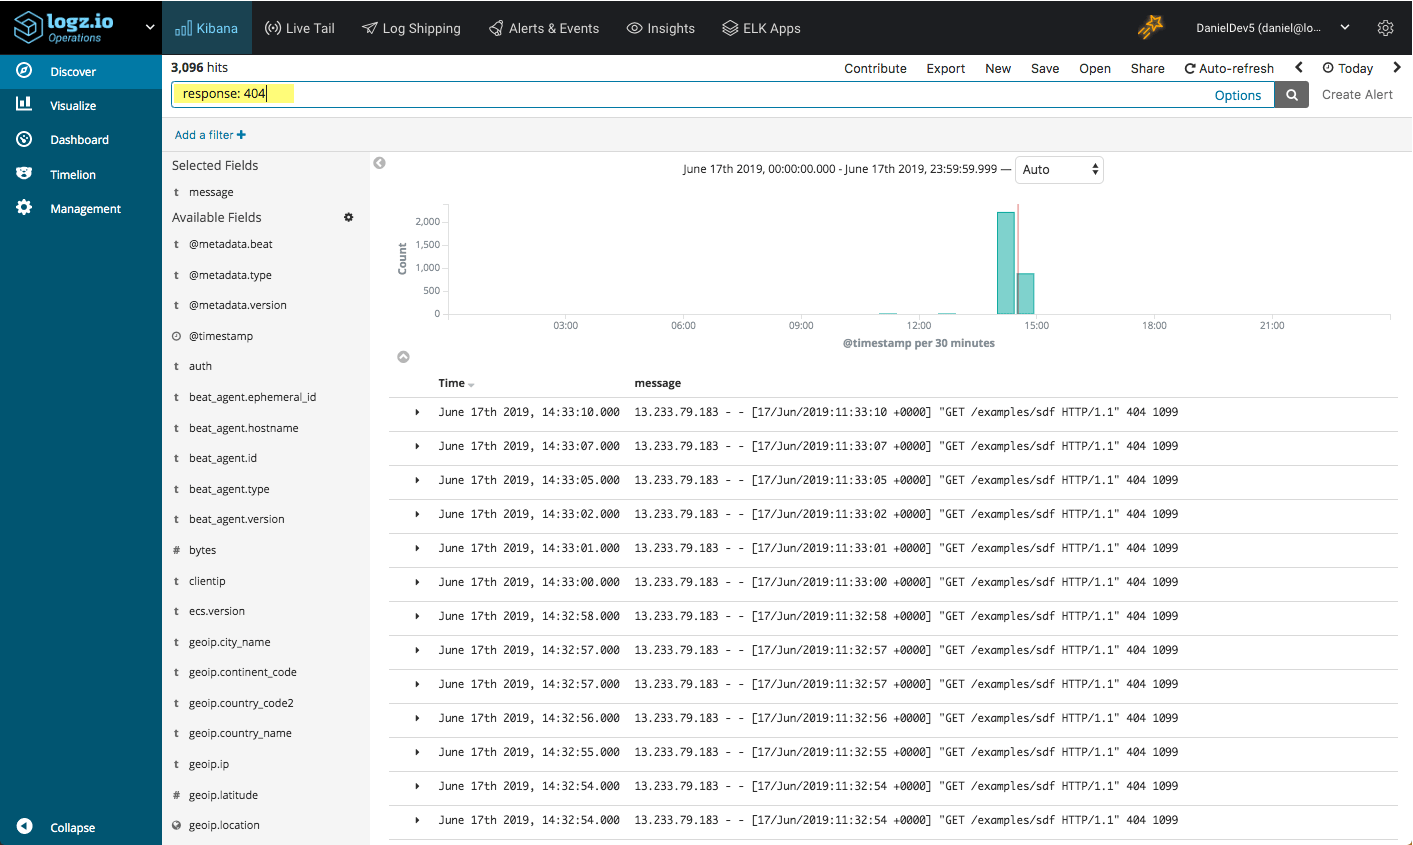
Or, you can use a field-level search to look for all 404 responses:
Response: 404
Using a range, you could search for all 4** responses:
response >= 400

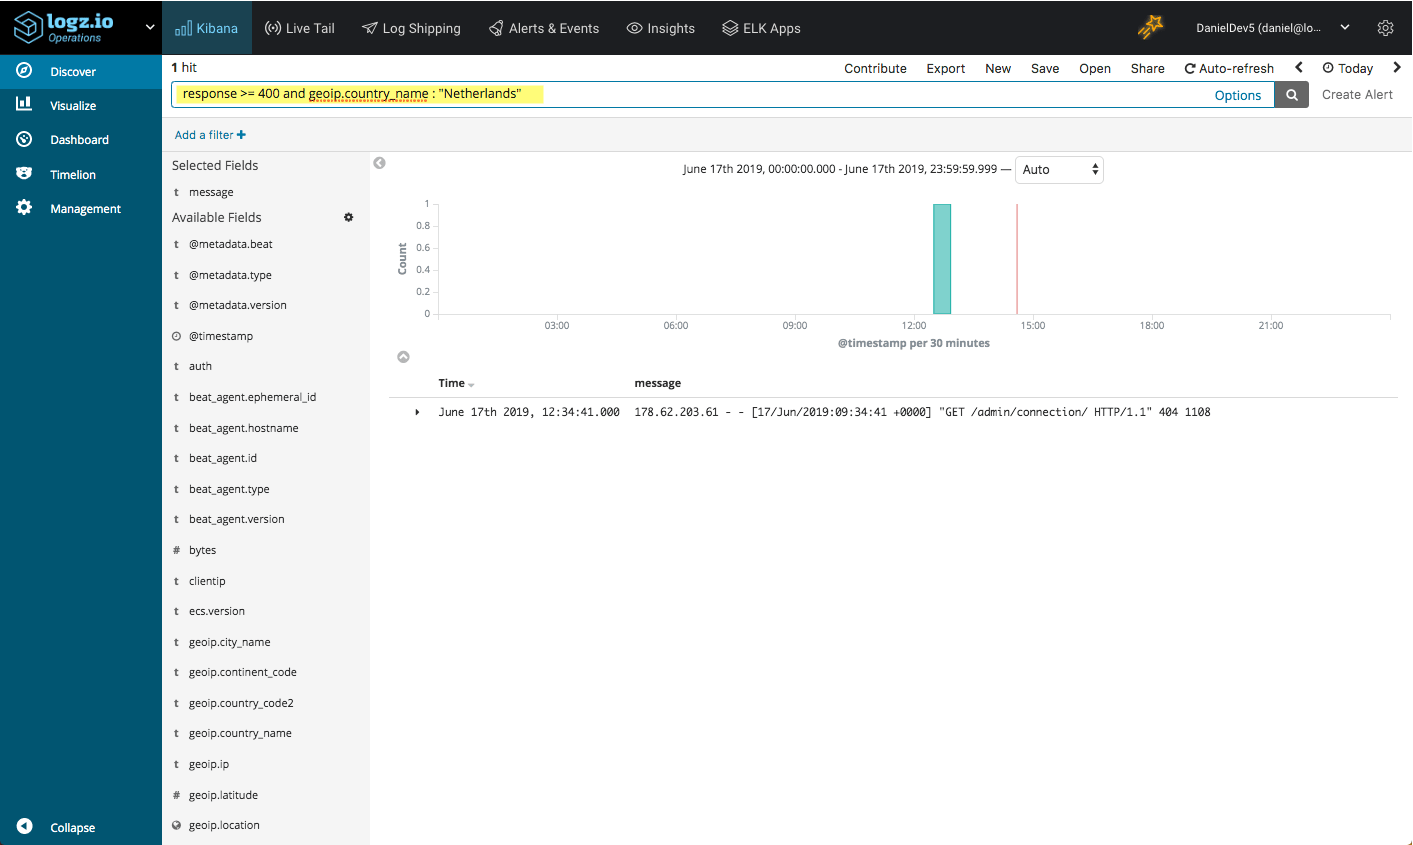
How about all error responses originating from a specific country?
response >= 400 and geoip.country_name : "Netherlands"
These are just some basic examples. Again, Kibana offers a wide array of querying options to choose from. Check out this article for more information on these options.
Step 4: Visualizing Tomcat logs
Of course, Kibana is renowned for its visualization capabilities and the last step in this article is to see how we can apply these capabilities to Tomcat access logs. Kibana provides almost 20 different visualization types which you can choose from. Here are some examples.
No. of requests
Use a Metric visualization, for example, for displaying single metrics. In the visualization below, we’re displaying the total no. of requests being sent. You could also breakdown this number per server in case of multiple Tomcat instances.

A line chart will help you visualize the number of requests over time:

Response breakdown
Another simple visualization outlines the most common response types to requests. We could use various visualization types for this, but here we’re using a pie chart:

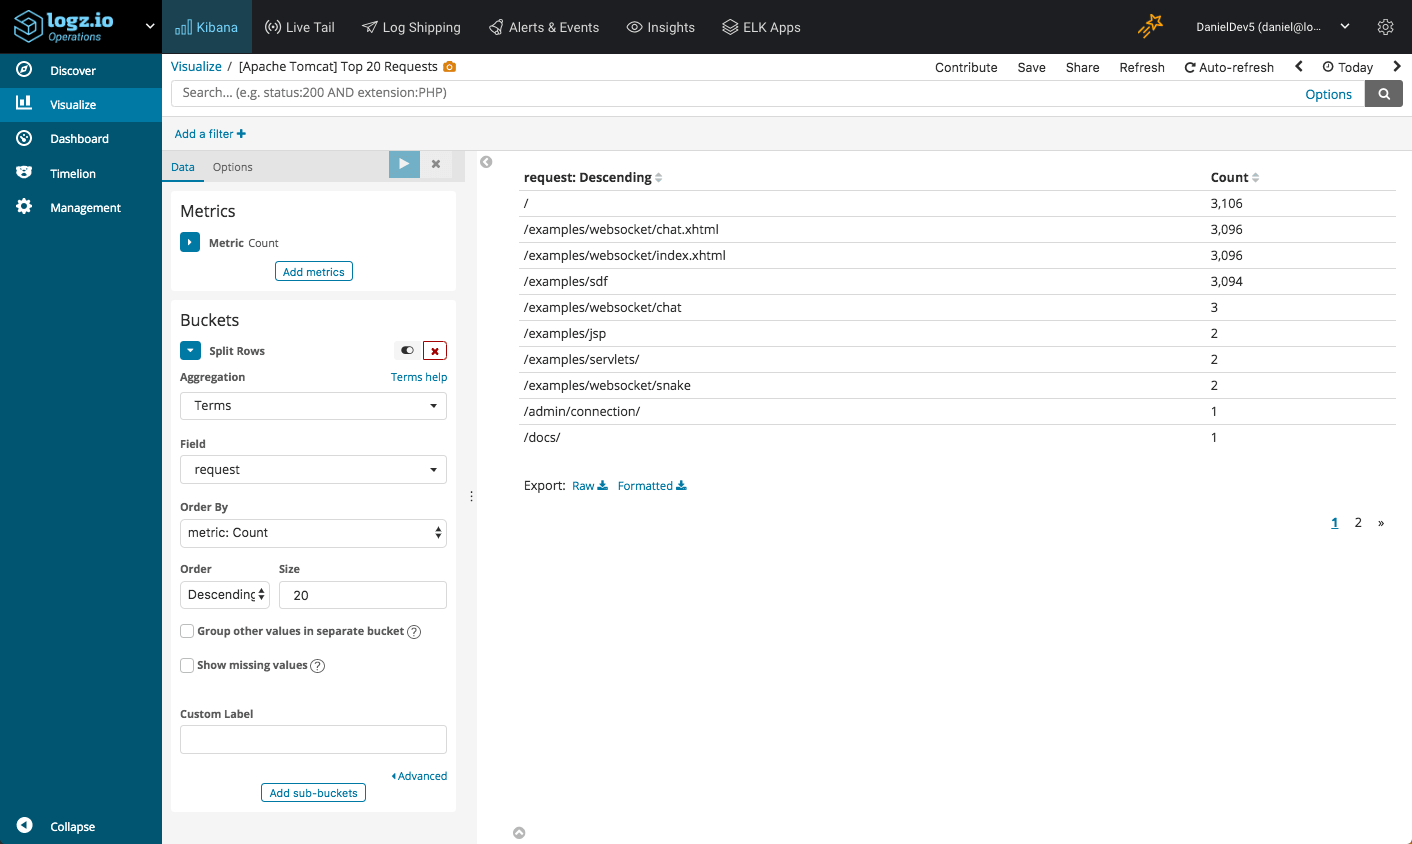
Top requests
It’s always interesting to monitor what URLs are being called the most. To visualize this, we can use a Data Table visualization:
Requests map
Where are request coming from? This is especially important for security reasons but also for infrastructure optimization. We’re using a Coordinate Map visualization that uses the geo-enhanced fields in the Tomcat access logs:

Once you have your visualizations lined up, you can add them all up into one beautiful Kibana dashboard:

This dashboard is available for use in ELK Apps — our free library of premade dashboards, visualizations and alerts for different log types. If you’re a Logz.io user, simply open the ELK Apps page and search for ‘Tomcat’ for an easy 1-click install.
Endnotes
Tomcat access logs provide valuable information on the traffic being served. The ELK Stack allows you to aggregate the logs, process them, and of course, analyze them using queries and visualizations.
Of course, access logs are just one part of the puzzle. For accurately gauging Tomcat performance, these logs should be combined together with Tomcat’s Catalina logs and JMX metrics. Together, these data sources will provide you with a more complete picture on how Tomcat is performing and we will look into using these additional data sources in the articles in this series.