
AWS Cost and Usage Report Analysis with Logz.io and the ELK Stack – Part 1
This blog series will describe how to ship and analyze AWS cost and usage reports using Lambda and Logz.io’s ELK Stack. In part 1, we will describe how to set up a pipeline using a Lambda shipper. In part 2 we will show how to analyze and monitor these reports using Kibana queries and visualizations.
If you’re building a production-grade and business critical application on AWS, monitoring the resources it depends on and consumes is critical to gauge your operational and ongoing costs. Indeed, most of us will find ourselves walking a delicate tight rope, trying to find a balance between the performance of our applications and the costs their development and maintenance involves.
AWS pricing is based on a pay-as-you-go approach. You pay at the end of the month only for the services you used, and just for that duration. This approach gives users amazing flexibility but also makes a lot of room for fine tuning.
One way to make these adjustments and optimize costs is by making use of AWS Cost and Usage reports. Using these reports, you can track the amount of money you spend on DEV services or see which operation is the most expensive one. With the right dashboard, you can analyze and monitor the way you are using different AWS services and actually cut costs.
Shall we see how?
AWS Cost and Usage reports
AWS cost and usage reports are CSV files that AWS delivers to an S3 bucket which you specify in your account. AWS promises to update the report up to three times a day. It’s worth noting that the prices in the report are estimated and are subject to change during the rest of the month as you use more of the services.
What’s in the report?
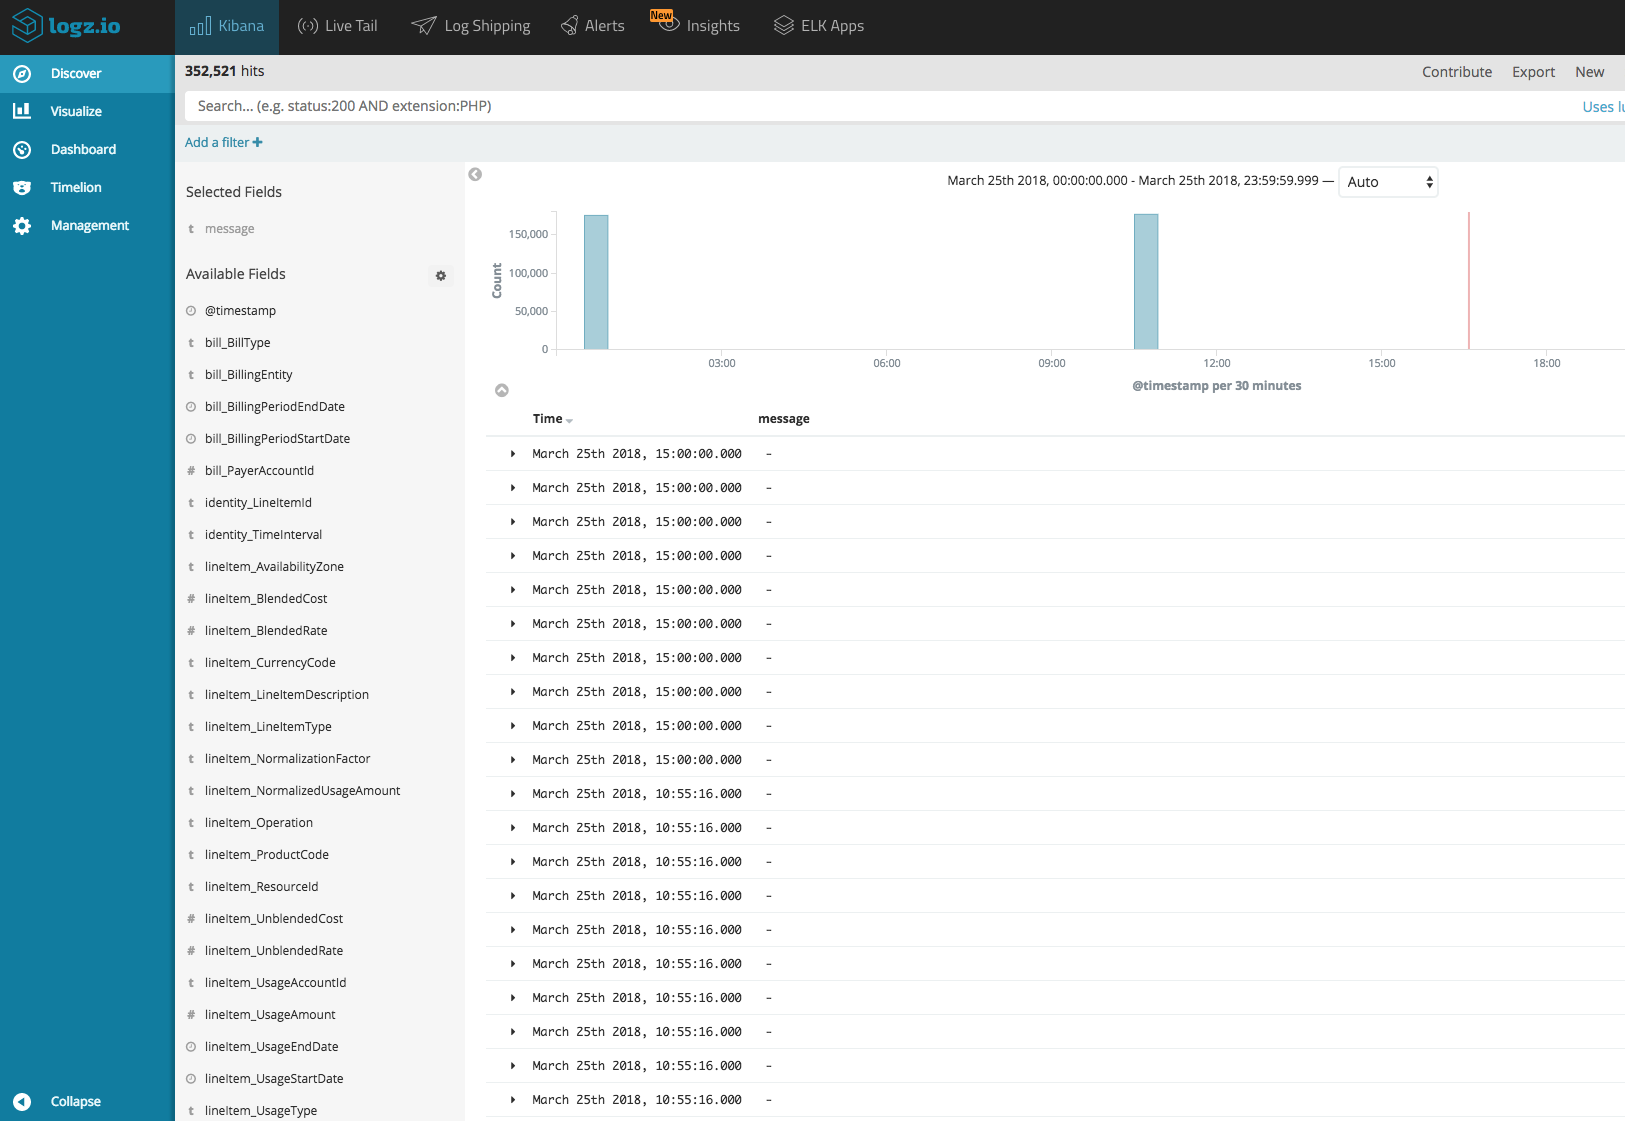
The report contains line items for each unique combination of AWS product, usage type, and operation that your AWS account uses, and the information can be aggregated either by the hour or by day.
The screenshot below is an example of how detailed these reports are and what kind of information you can gather about your usage of AWS services.
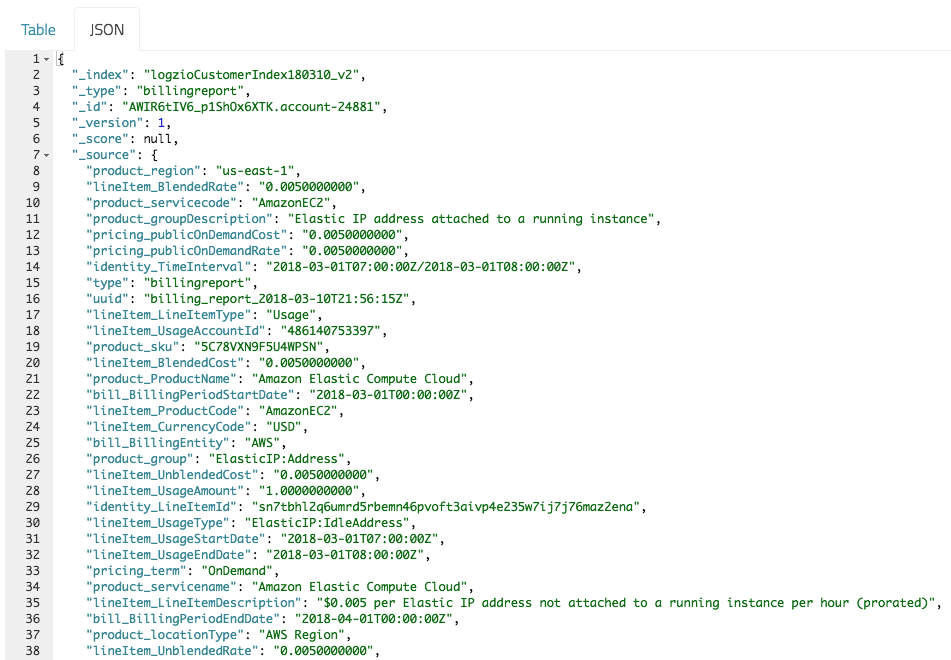
These reports can be extremely useful for keeping tabs on usage and costs, but their downside is obvious — they are extremely large and difficult to analyze. And as your business grows and your application with it, you will begin using more and more AWS services. The result being larger and longer reports.
Therefore, the biggest challenge is extracting insights from the reports. In the next sections we will examine how to ship the reports into Logz.io’s ELK Stack using a Lambda function which also processes the data.
Enabling AWS Cost and Usage Reports
The process of shipping AWS Cost and Usage reports into Logz.io begins with enabling them in our AWS account.
First, we need to create an S3 bucket that will contain the reports.
To do so, go to the S3 console and select Create bucket. Give it a notable name, and click on Create.
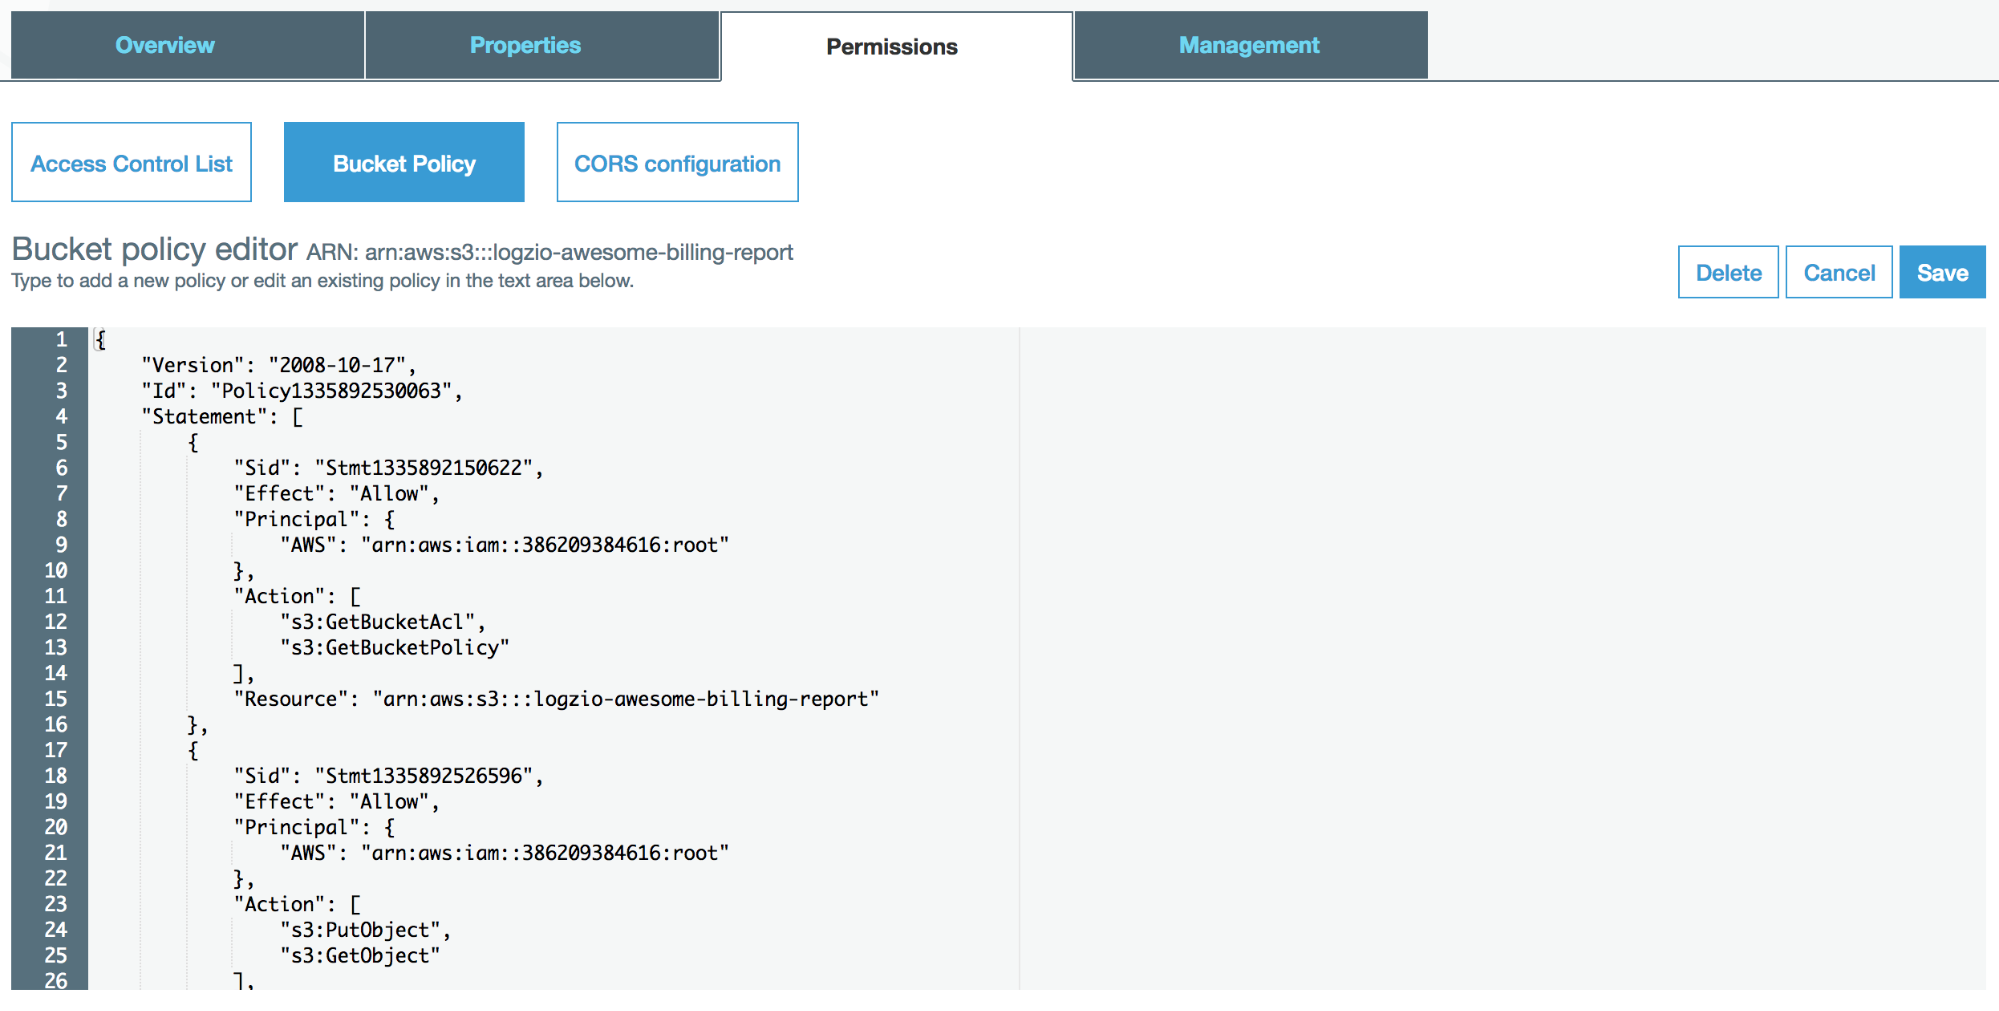
As with any AWS service, configuring the correct permissions is crucial.
Select the newly created bucket, and under Permissions click on Bucket Policy. Be sure to fill your bucket name, and enter the following policy:
{
    "Version": "2008-10-17",
    "Id": "Policy1335892530063",
    "Statement": [
        {
            "Sid": "Stmt1335892150622",
            "Effect": "Allow",
            "Principal": {
                "AWS": "arn:aws:iam::386209384616:root"
            },
            "Action": [
                "s3:GetBucketAcl",
                "s3:GetBucketPolicy"
            ],
            "Resource": "arn:aws:s3:::<your_bucket_name>"
        },
        {
            "Sid": "Stmt1335892526596",
            "Effect": "Allow",
            "Principal": {
                "AWS": "arn:aws:iam::386209384616:root"
            },
            "Action": [
                "s3:PutObject",
                "s3:GetObject"
            ],
            "Resource": "arn:aws:s3:::<your_bucket_name>/*"
        }
    ]
}
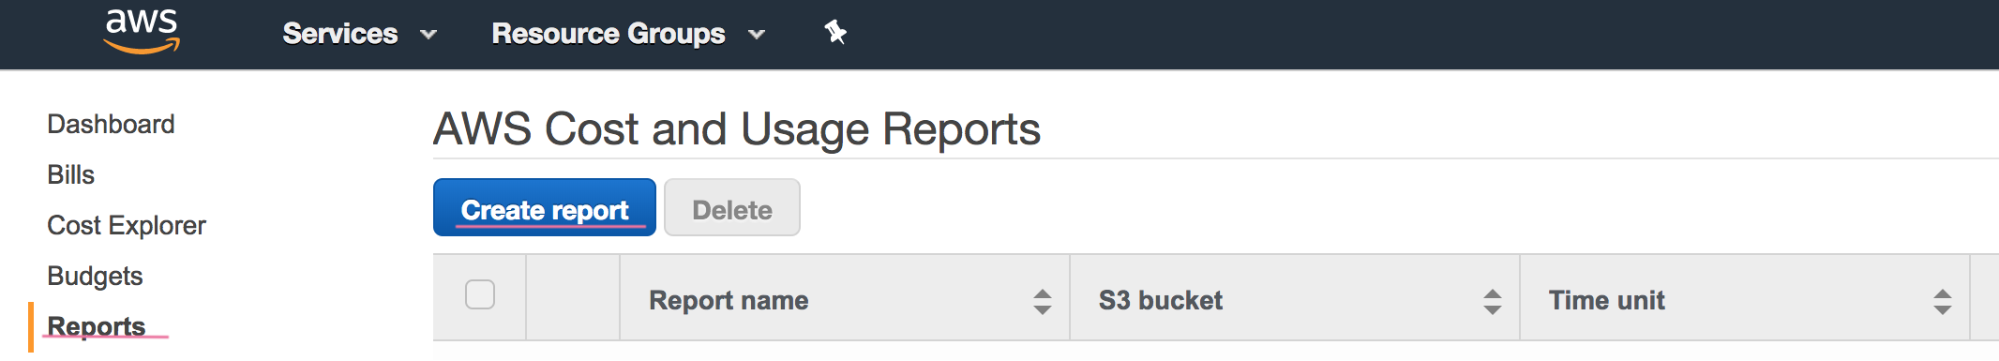
The next step is to enable the reports.
Open the AWS Billing console, select Reports on the left side menu, and hit the Create report button.
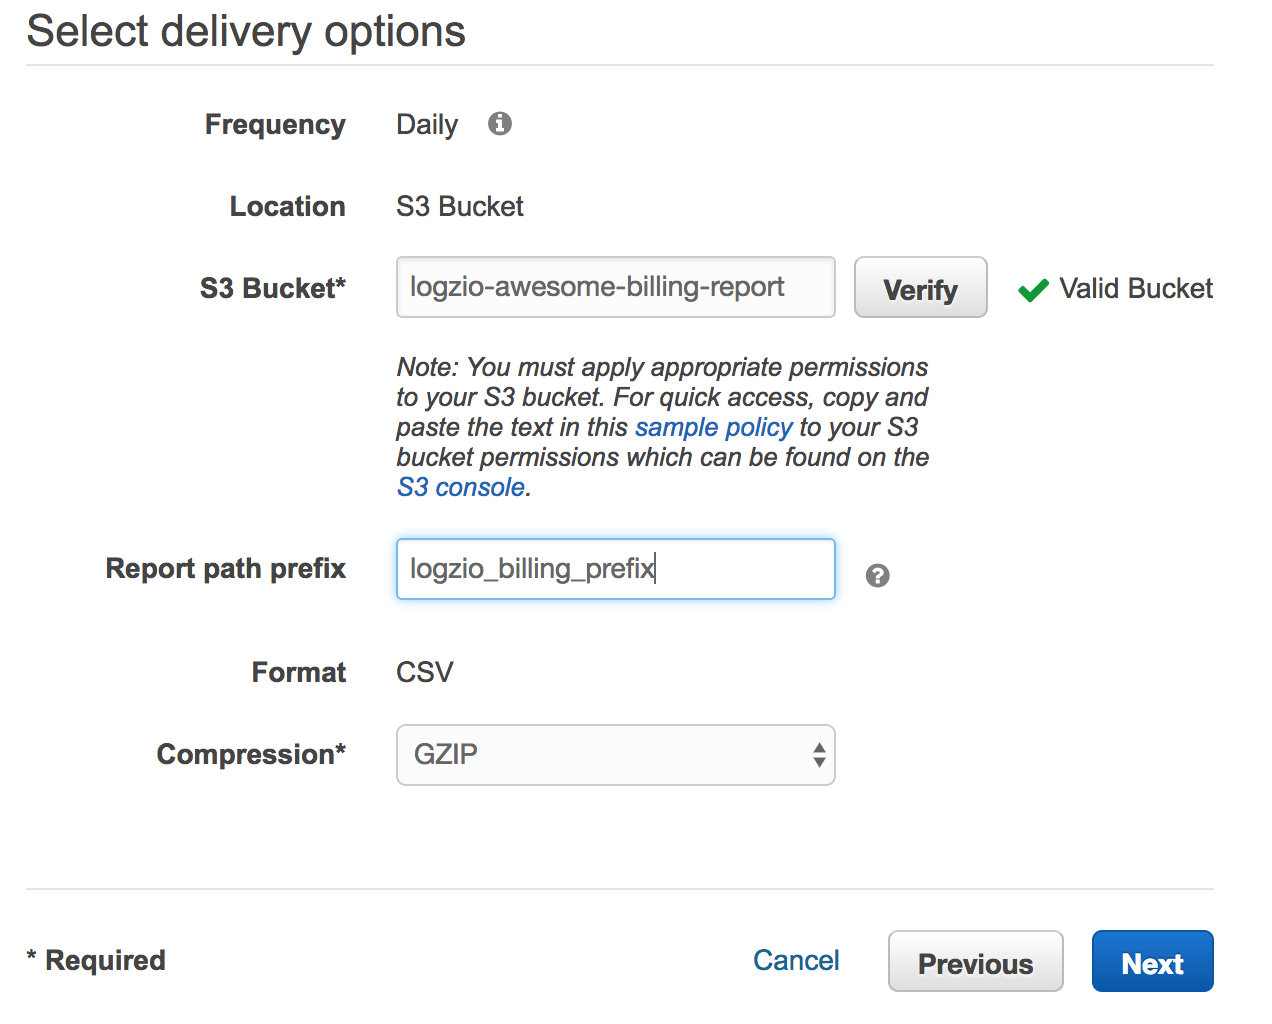
Configure the following:
- Report name – Self-explanatory 🙂
- Time unit – The time unit the data will be aggregated in the report. Can be either hourly or daily.
Note: Enabling hourly reports does not mean that a new report is generated every hour. It means that data in the report is aggregated with a granularity of one hour. - Include – Additional details about individual resources IDs can be included in the report Important! This might significantly increase report size and might affect performance. AWS Lambda can run for up to 5 minutes with up to 3008MB, and the process time for the whole file must end within this timeframe.
- Support for Redshift and QuickSight – Leave these options unchecked.
Click Next.
Fill in your bucket name and click Verify to make sure the S3 bucket has the correct permissions.
Make sure you select GZIP compression.
Creating the Lambda Shipper
Detailed explanations on how to create Logz.io’s AWS Cost and Usage Report Lambda shipper can be found on our Github repository, together with the function resources themselves. Just a few clarifications however.
In the src folder, you will find two files: ‘shipper.py’ and ‘lambda_function.py’. The former is responsible for shipping the data to Logz.io while the latter is in charge of parsing.
You will need to zip the two files and then upload them to your Lambda console. Please make sure you have the right permissions (you will need s3:get and s3:list), and that you have filled in the correct environment variables as detailed in the instructions.
The next step is to set the trigger to invoke the Lambda function to collect the cost and usage reports. To do this you will need to create a new CloudWatch Events trigger and configure a schedule expression for it.
Please note that AWS publishes report updates up to three times a day so there is no need to define a frequently occurring event. We recommend starting with 10-hour rate — `rate(10 hours)`.
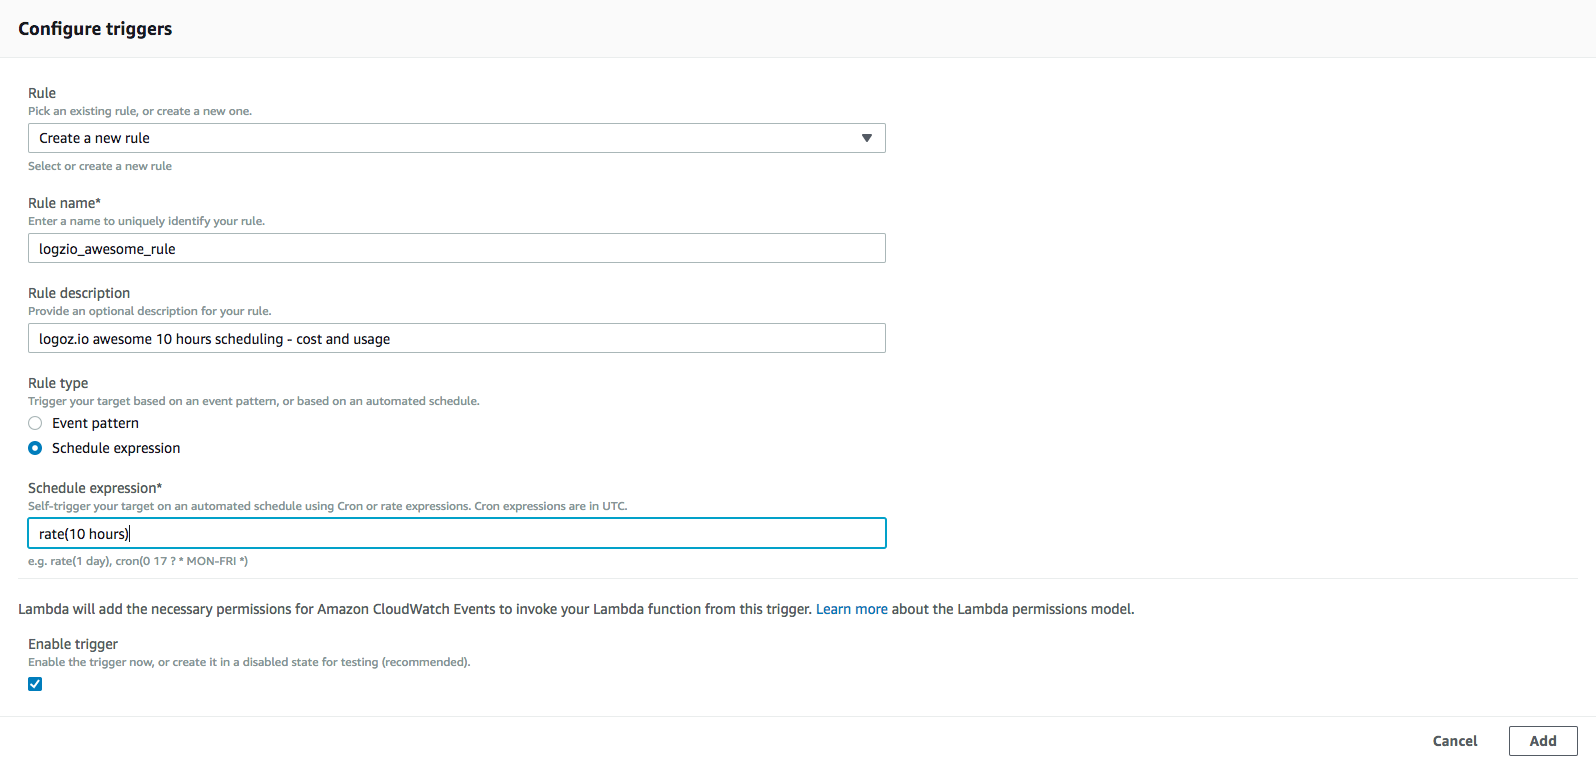
Once you’ve added the new trigger and saved the Lambda function, data should begin to ship to Logz.io once every 10 hours.
Congrats! You have successfully created AWS Cost and Usage reports and shipped them into Logz.io for further analysis in Kibana. In the next part of the series, we will show how to query and visualize the data and be more proactive about it using alerts.
You Might Also Like

Multi-Cloud Archive & Restore: Azure Blob Storage and AWS S3 Support

How to Control Logging Costs with Logz.io
Get started for free
Completely free for 14 days, no strings attached.