
Troubleshooting 5 Common ELK Glitches

Getting started with the ELK Stack is straightforward enough and usually includes just a few commands to get all three services up and running. But — and this is big “but” — there are some common issues that can cause users some anguish.
More on the subject:
The first piece of good news is that these issues are usually easy to resolve. The other piece of good news is that we’ve put together the top five most-common issues and explained how to troubleshoot them.
#1. Kibana is Unable to Connect to Elasticsearch
You’ve installed Elasticsearch, Logstash, and Kibana. You open the latter in your browser and get the following screen:
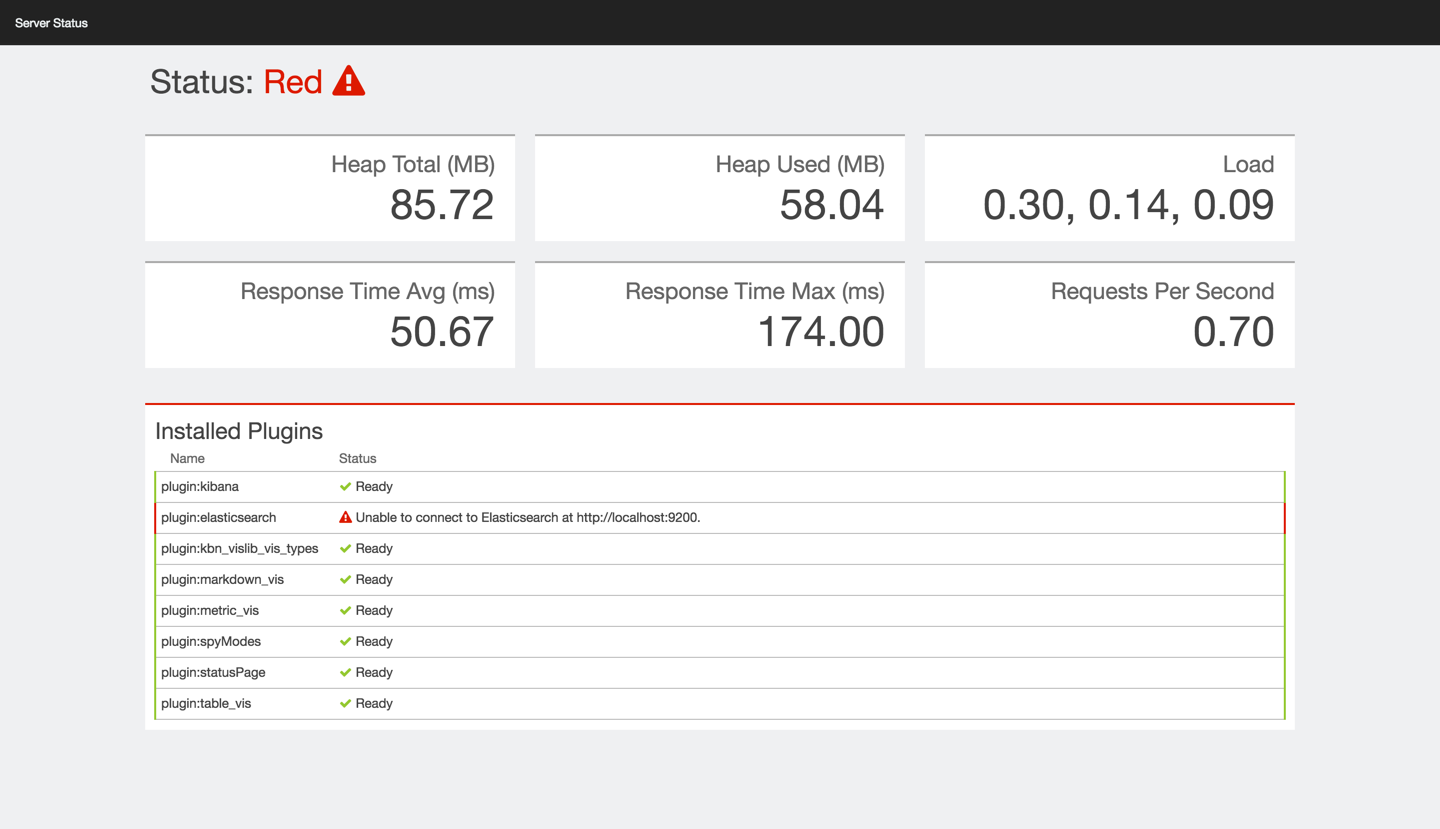
All is not lost! This is a pretty common issue, and it can be easily resolved.
As the error message implies, Kibana cannot properly establish a connection with Elasticsearch. The reasons for this vary, but it is usually a matter of defining the Elasticsearch instance correctly in the Kibana configuration file.
Open the file at /opt/kibana/config/kibana.yml and verify that the server IP and host for ‘elasticsearch_url’ are configured correctly (both the URL and port):
Here is an example for a locally-installed Elasticsearch instance:
elasticsearch_url: "http://localhost:9200"
Restart Kibana:
sudo service kibana restart
That should do it. If the problem persists, there may be an issue with Elasticsearch. Check out the Elasticsearch troubleshooting sections below.
#2. Kibana is Unable to Fetch Mapping
In this case, Kibana has established a connection with Elasticsearch but cannot fetch mapping for an index:
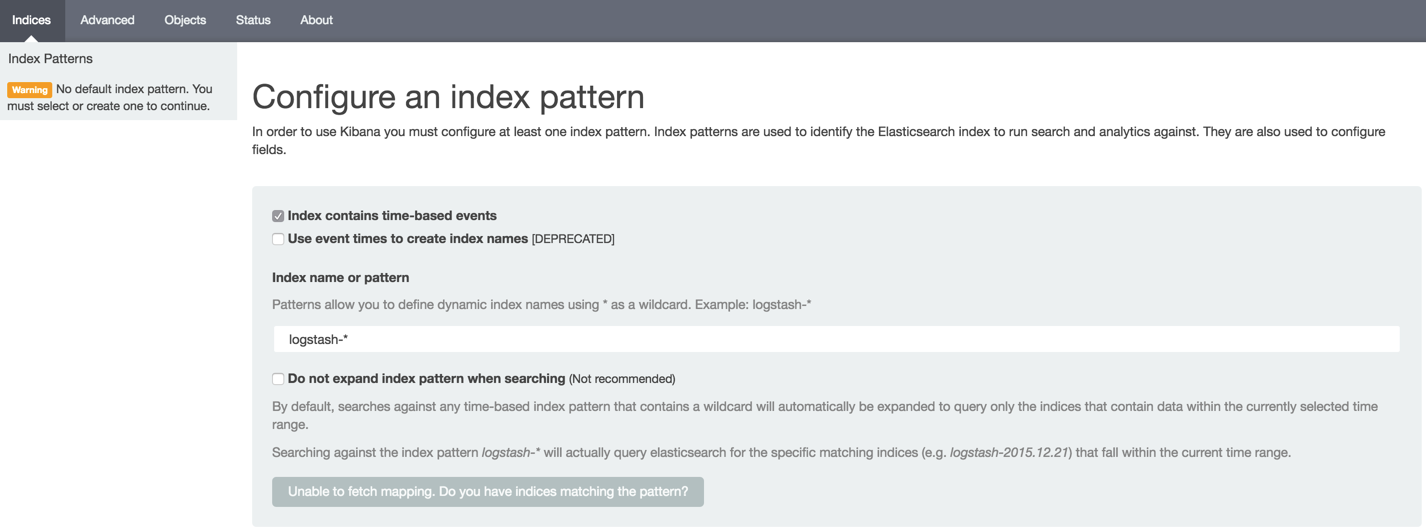
As the message displayed on the grey button at the bottom of the page indicates, Kibana cannot find any indices stored in Elasticsearch that match the default logstash-* pattern — the default pattern for data being fed into the system by Logstash (which is the method Kibana assumes you are using).
If you’re not using Logstash to forward the data into Elasticsearch or if you’re using a non-standard pattern in your Logstash configuration, enter the index pattern that matches the name of one or more of your Elasticsearch indices. If Kibana finds the index pattern, the grey button will turn into a pretty green one, allowing you to define the index into Kibana.
If you are using the conventional Logstash configuration to ship data, then there is most likely a communication issue. In other words, your logs aren’t making it into Elasticsearch. For some reason, either Logstash or Elasticsearch may not be running. See the sections below for more details on how to make sure that these services are running properly.
#3. Logstash is Not Running
Logstash can be a tricky component to manage and work with. We’ve previously covered a number of pitfalls you should look out for, but there are a number of reasons that Logstash still may not be running even after taking care to avoid these landmines.
A common issue causing Logstash to fail is a bad configuration. Logstash configuration files, which are located in the /etc/logstash/conf.d directory, follow strict syntax rules that, if broken, will cause a Logstash error. The best way to validate your configurations is to use the configtest parameter in the service command:
$ sudo service logstash configtest
If there’s a configuration error, it’ll show up in the output. Fix the syntax and try to run Logstash again:
$ sudo service logstash restart
Check the status of the service with:
$ sudo service logstash status
If Logstash is still not running after you fix the issue, take a look at the Logstash logs at: /var/log/logstash/logstash.log.
Read the log message and try to fix the issue as reported in the log. Here’s an example of a log message warning us of a deprecated host configuration:
{:timestamp=>"2016-05-30T08:10:42.303000+0000", :message=>"Error: The setting `host` in plugin `elasticsearch` is obsolete and is no longer available. Please use the 'hosts' setting instead. You can specify multiple entries separated by comma in 'host:port' format. If you have any questions about this, you are invited to visit https://discuss.elastic.co/c/logstash and ask.", :level=>:error}As the message itself points out, use the Elastic forums to search for an answer to the particular issue you’ve encountered and as reported in the log.
#4 Logstash is Not Shipping Data
You’ve got Logstash purring like a cat, but there is no data being shipped into Elasticsearch.
The prime suspect in this case is Elasticsearch, which may not be running for some reason or other. You can verify this by running the following cURL:
$ curl 'http://localhost:9200'
You should see the following output in your terminal:
{

 "name" : "Jebediah Guthrie",

 "cluster_name" : "elasticsearch",

 "version" : {

   "number" : "2.3.1",

   "build_hash" : "bd980929010aef404e7cb0843e61d0665269fc39",

   "build_timestamp" : "2016-04-04T12:25:05Z",

   "build_snapshot" : false,

   "lucene_version" : "5.5.0"

 },

 "tagline" : "You Know, for Search"

}
If Elasticsearch is still not shipping data, skip over to the Elasticsearch troubleshooting section below for more reasons why Elasticsearch might not be running properly.
Another common issue that may be causing this error is a bad output configuration in the Logstash configuration file. Open the configuration file at: /etc/logstash/conf.d/xxx.conf and verify that the Elasticsearch host is configured correctly:
output {
  elasticsearch {}
 }
Restart Logstash:
$ sudo service logstash restart
#5 Elasticsearch is Not Running
How do you know Elasticsearch is not running? There are a number of indicators, and the most obvious one is that no no logs are appearing in Kibana. As specified above, the most reliable way to ping the Elasticsearch service is by cURLing it:
$ curl 'http://localhost:9200'
If all is well, you should see the following output in your terminal:
{

 "name" : "Jebediah Guthrie",

 "cluster_name" : "elasticsearch",

 "version" : {

   "number" : "2.3.1",

   "build_hash" : "bd980929010aef404e7cb0843e61d0665269fc39",

   "build_timestamp" : "2016-04-04T12:25:05Z",

   "build_snapshot" : false,

   "lucene_version" : "5.5.0"

 },

 "tagline" : "You Know, for Search"

}
If not, the output will look like this:
curl: (7) Failed to connect to localhost port 9200: Connection refused
Now, there are a number of possible reasons Elasticsearch is not running.
First, if you just installed Elasticsearch, you need to manually start the service because it is not started automatically upon installation:
$ sudo service elasticsearch start
 * elasticsearch is running
If you still get a message that Elasticsearch is not running, you will have to dig in deeper. As with Logstash, the best place to try and debug the service is the log file: /var/log/elasticsearch/elasticsearch.log.
A common cause for a failing Elasticsearch is a bad host definition in the configuration file. Live tailing of the log file while starting the service is a good method for identifying a specific error. Here is an example:
2016-05-30 07:40:36,799][ERROR][bootstrap] [Condor] Exception BindTransportException[Failed to bind to [9300-9400]]; nested: ChannelException[Failed to bind to: /192.0.0.1:9400]; nested: BindException[Cannot assign requested address];
The host configuration is located in the Network section of the Elasticsearch configuration file, and it should look like this:
//When Kibana and Elasticsearch are hosted on the same machine
 network.host: localhost
 http.port: 9200

//When Kibana and Elasticsearch are hosted on different machines

network.bind_host: 0.0.0.0
 http.port: 9200
 network.publish_host: <ServerIP>
Verify the configuration, and restart the service:
$ sudo service elasticsearch restart
If the issue is not the host definition, the log will give you an indication as to the cause of the error and will help you resolve it. Search the Elastic forums — the chances are that someone else has encountered the issue before.
And one last tip (on Ubuntu only): If you had Elasticsearch working properly and it suddenly it stopped, this might be due to a restart of your server as Elasticsearch is not configured to start on boot. To change this, you can use:
$ sudo update-rc.d elasticsearch defaults 95 10
A Final Note
Here at Logz.io, we’ve had a lot of experience with troubleshooting the various quirks in the ELK Stack. This article covered some common and basic setup issues that newcomers to the system might encounter. More advanced tips can be found in these Elasticsearch and Logstash cheatsheets.
Happy indexing!
You Might Also Like

ELK-Based SecOps with Logz.io Security Analytics

Integration and Shipping Okta Logs to Logz.io Cloud SIEM
Get started for free
Completely free for 14 days, no strings attached.