Tips on Logging Microservices

Microservices architecture is a style of software architecture that focuses on developing an application that is comprised of many fine-grained components, with each one being responsible for a small part of the business. These components are independent, run on their own processes, and communicate with each other to achieve business goals.
Why care about logging?
We’ve been seeing a lot of companies breaking down their monolithic applications into microservices. When we break a large application into microservices we are creating loosely coupled modules that can be tested easily, reducing the risk of changes. Also these modules can be deployed independently enabling horizontal scaling. However, there are some issues that might not seem to be a big deal at first glance but can still cause a lot of pain. One of these is logging.
Logging is something that all applications, whether they have monolithic or microservices architectures, are going to do. The problem is that when we start to break down an application into microservices, we spend a lot of time thinking about the business boundaries and the best way to partition our application logic — but we forget to think about the logs.
Of course, you might ask: We’ve been doing logs in the same way since forever. Why do we need to worry about them now?
The reason is that tracking a transaction within a monolithic application already has some inherent difficulties, and sometimes only the logs can help you to understand what is going on. After all, the difficulty of monitoring and logging increases exponentially whenever your business logic is running in multiple services. If you don’t plan your microservice logging in a clever way, it can become impossible to understand what the application is doing.
That’s why I’d like to share some tips based on my experiences as a software developer. I’ve been using microservices for a few years and I share some thoughts about it on my personal blog. I hope that after reading this post, you’ll see the importance of thinking about logging.
Tip #1 — Have an application instance identifier
When using microservices, it is common to have multiple instances of the same component running at the same time. It’s important to have an instance identifier on the log entry that shows where that entry came from. It doesn’t really matter how you generate this ID as long as it is unique and allows you to trace back to the exact server/container and application that generated the entry. Having a service registry makes easy to have unique identifiers for each one of the microservices in your architecture.
Tip #2 — Always use UTC time
This tip is not exclusive to microservices architecture. Anyone working with a distributed application — or an application with components scattered all over the world — knows how annoying it can be if some of the components use the local time on the log entries. All problems related to locally-timed log entries are exponentially worse in a microservices architecture. If you do need the local time, you can always have the time zone as a field on the log entry so it will be easy to retrieve the information. But it’s important to have a field with the UTC time that will be used to order messages in the aggregation tool (more about the aggregation tool later).
Look at the following hypothetical log messages:
{
   "message": "I'm the first event",
   "level": "INFO",
   "date": "2016-06-12T05:00:00",
   "timezone": "Pacific/Auckland"
}

{
   "message": "I'm the second event",
   "level": "INFO",
   "date": "2016-06-11T14:05:00",
   "timezone": "America/Sao_Paulo"
}
The first one was generated by a service running in New Zealand. The second one was generated by a service running in Brazil. Because we are using local dates, the message generated in the Brazilian service will appear before the New Zealand message when ordered by date. But they haven’t been generated in this order.
Now, look into the following example using UTC time and the timezone:
{
   "message": "I'm the first event",
   "level": "INFO",
   "date": "2016-06-11T17:00:00",
   "timezone": "Pacific/Auckland"
}


{
   "message": "I'm the second event",
   "level": "INFO",
   "date": "2016-06-11T17:05:00",
   "timezone": "America/Sao_Paulo"
}
These messages will be ordered correctly by date and if you need to know the local time when the message was generated, you just need to convert it from UTC to the specific timezone.
Tip #3 — Generate request identifiers
When breaking down your business logic into different components, you’ll end up with logical transactions that are scattered across one or more components. When you need to trace these transactions, it can be tough if you don’t have any identifiers for them. You should generate a unique identifier for each transaction that can be used later to correlate events and trace your transactions easily.
Imagine that you have the following sequence of requests for buying a product on some e-commerce website:
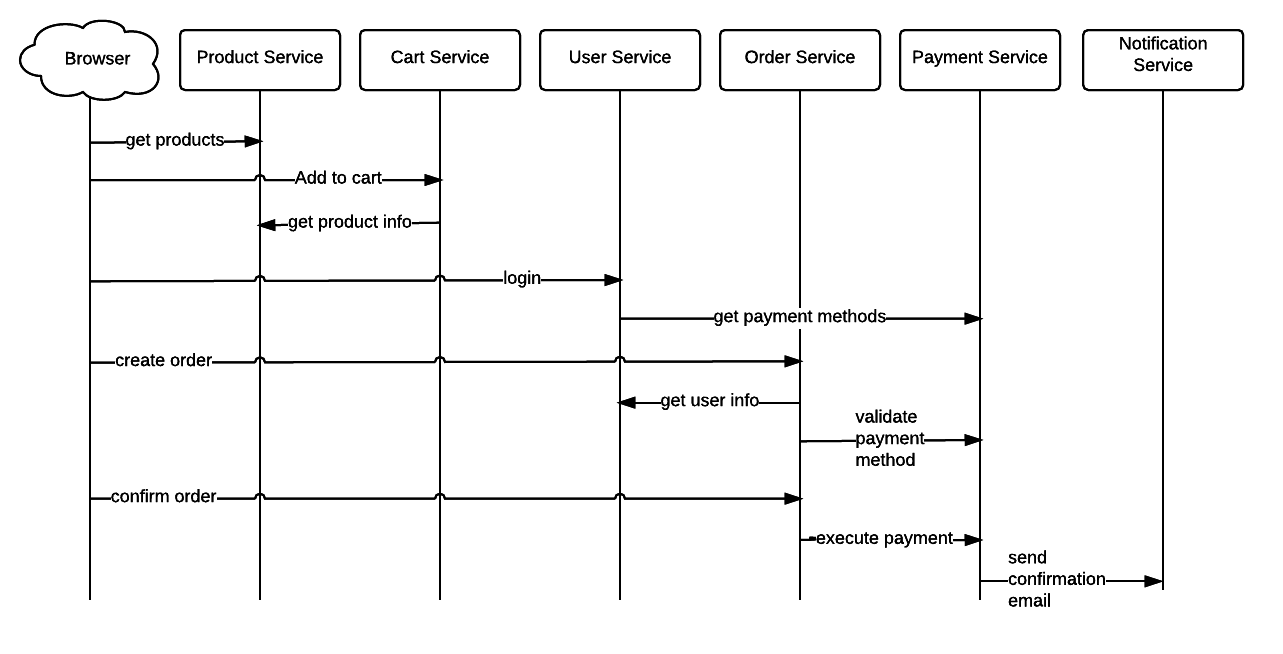
How you are going to group these operations together really depends on what exactly is the definition of a transaction (after all, they could also be nested). The important thing is to make sure that at the beginning of the transaction, you’ll create one identifier that will be passed down and used in the log entries until the end of the transaction.
Usually, I tend to use artificially-generated IDs for identifying my transactions. You can use the user_id or maybe the session_id for user-related transactions. When it comes to ordering checkout and payment, you can use the order_id to trace the order checkout and payment tentatives. But this assumes that you have a logged-in user or that you have already created an order that has an order_id — and that’s not always true. By using artificial IDs for the transactions, you can decouple the transaction identifiers from the business logic flows.
It’s important to keep in mind that the identifier needs to have enough information to distinguish this transaction from all of the other transactions in your system. Sometimes the transaction identifier will be a combination of fields present in the log entries.
Tip #4 — Group logs using an aggregation tool
All of these tips are meaningless if you don’t have a way to aggregate your log entries from all of your microservices and a tool that allows you to group and query these entries easily. I’ve been using the ELK stack to do so with magnificent results. Just in case you haven’t heard about ELK before, it’s a combination of three applications that together provide a full solution for dispatching log entries, storing and indexing them, and then aggregating and visualizing the information.
More on the subject:
There are a lot of different patterns and approaches for scaling and distributing application logs using ELK, so I won’t dive into the details about how to do it here. You can take a look at material such as this Logstash tutorial published on the Logz.io Blog to see some tips for deploying and scaling. Also, it’s possible to use some enterprise services such as Logz.io to deal with the hassle of setting up and maintaining the logging infrastructure so that you can focus on applying the best microservices logging practices.
Conclusion
My goal in this post is to show how important it is to think about logging in a microservices architecture and then share some of the best practices that have proved themselves really useful in my experience with microservices.
This is just the beginning, and I’m sure that there many other ways to solve this logging issue. I’d love to hear your opinions on my tips, and it would be great to see some of yours in the comments.
You Might Also Like

Ensure 100% Reliability of Your Marketplace with Logz.io

Logz.io Cloud SIEM Available on AWS AppFabric at Launch
Get started for free
Completely free for 14 days, no strings attached.