Lessons Learned from Elasticsearch Cluster Disconnects

If you are running large Elasticsearch clusters on Amazon Web Services for log analysis or any other search function, you’re probably suffering from some form of Elasticsearch cluster issue.
I know we used to. When we crossed the multi-billion-records-per-cluster threshold, we started seeing different kinds of scalability issues.
I wanted to discuss one of the first issues we had and then go through the process we went through to find the root cause of the problem. Many of us rely on Elasticsearch to run our businesses, and I’m sure making sure that it operates smoothly — and that is a top priority for many people.
The Initial Elasticsearch Alert
As a log analytics company, we intensively use our platform to monitor our internal clusters. A while back, we had noticed that one of our clusters has started to generate “Node disconnection” events. It started with one node. Then another node, and it started to spread even further. It was not good, to say the least:
....org.elasticsearch.transport.NodeNotConnectedException....
The Initial Research
We started running through a couple of steps, here are some of them:
- Increased the level of resources that were being devoted to the machine.
- Checked to see if the network interface or CPU were overloaded — or if perhaps if there were a bottleneck somewhere.
- We figured it must be a networking issue, so we have increased cluster sync timeouts
- Looked at all of the available data in our Docker-based environment.
- Searched online including places such as StackOverflow and Elasticsearch user groups.
- We even spoke to a few people directly at Elastic but had no luck.
- At disconnection time, we could not find any anomaly in load or in any other parameter. It felt almost like a random, freak occurrence.
None of these steps really took us any closer to the resolution of the problem.
The Power of Correlation
As part of a different project, we had started to ship various OS-level log files such as kern.log to our log analysis platform.
That was actually where we were able to achieve a breakthrough. Finally, we saw that there was a clear correlation between Elasticsearch disconnections and a cryptic error log from the kern.log file. Here it is:
xen_netfront: xennet: skb rides the rocket: 19 slots
Obviously, we had no idea what that message meant and if it had anything to do with the Elasticsearch cluster issues.
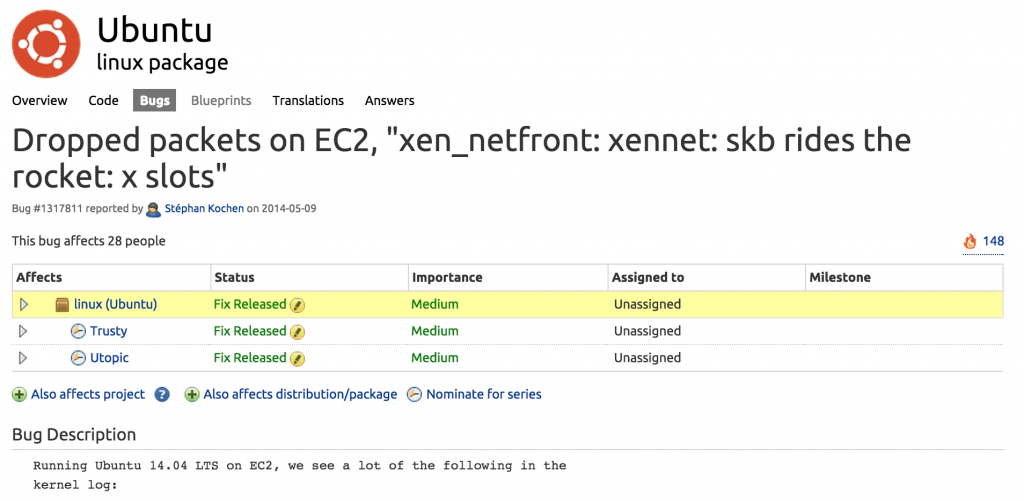
So, we had spent some time researching this issue and found out that this event actually means that there is something wrong with the network interface in the machine itself — a packet is being dropped by the network device. Now, that made more sense and we were quickly able to come up with a solution to the problem by finding this thread on Launchpad:
This is a bug in Ubuntu’s network interfaces (which are the default Ubuntu AWS offer). To solve the problem, we disabled the Scatter / Gather ability in the network interface. To do the same, just add this to your AWS and Elasticsearch clusters:
//To see if scatter-gather is ON on eth0:
ethtool -k eth0 |grep sca
//to set it to off:
ethtool -K eth0 sg off
The Big Picture
We were lucky to have solved the problem by correlating these issues together — but companies cannot and should not depend on luck. Bad luck is expensive. We had a difficult time finding the answer because, first, we did not aggregate all logs to a central location and, second, we did not know the questions that we should be asking.
When running a large environment, problems can originate from an issue in one of many different databases, a network disruption causing an application-level issue, a spike in CPU on the disk-level side, or something else in the operating system or other infrastructure.
It all boils down to a single issue:
How can people make sense of all of their log data?
The answer is fairly simple:
– Correlate all system events together to gain full visibility and then find the exact log entries that contain the answers
– Correlation is not enough, you need to understand what questions one should be asking about their data – if we had known in the first place that the “xen_netfront: xennet: skb rides the rocket: 19 slots” log message indicates a severe network interference, we would have saved a lot of time and effort.
More on the subject:
At Logz.io, we are laser-focused on tackling these two problems. In prior posts, we have started to share our enterprise vision for the ELK Stack. In the future, we will discuss in more detail how our customers are using Logz.io Insights to tackle the second problem.
Get started for free
Completely free for 14 days, no strings attached.


