
How to Benchmark Elasticsearch on AWS

Here at Logz.io, we run multiple large Elasticsearch clusters as well as Kafka, Spark, and Hadoop clusters on Amazon Web Services. We had been searching for any benchmarks that match our own use cases because we had been wanting to utilize our resources in the best possible way. We did not find any such benchmarks, so we did the job ourselves and wanted to share the results with the community.
Our Assumptions
When you do a benchmark, a few core assumptions should first be made. Here were ours:
- Elasticsearch benchmarking can be divided into two parts: indexing benchmarking and search benchmarking. Here, we will discuss indexing benchmarking and publish a second post on search benchmarking later.
- We would write a light stress test tool to be used in our tests. (See below.)
- The stress test tool would run from the instance itself.
- If one process of the stress test tool would not get the node saturated, then we would launch more and more until it did.
- A “saturated node” would be one whose CPU would be running at more than 70% capacity or would have a relative load average — the load average divided by the CPU count — of greater than 1.
- The indexing would be done with changing bulk sizes to one index with one shard and no replicas. According to Elastic, this is the way to go. (You can then multiply your results to get the actual data that you need.)
- Each benchmark cycle would run for thirty minutes, and that number would include garbage collections, Lucene merges, and all other time-based events in Elasticsearch.
- The benchmark would likely work for only our use case — logging. This process would probably not work for at least some other use cases.
- Our metric would be: “What do we need to index 1 TB of data per day, per single instance?”
Our Stress Test Tool
To check performance on instances, we needed a tool that would create “log like” documents and index them. We could not find a proper one online, so we created one ourselves using Python and Elasticsearch’s official Python library. It fit our needs and gave us control over the documents that were being indexed as well as their sizes. (Of course, anyone is free to download the tool on our GitHub page!)
Instance Stores
Under its Indexing Performance Tips knowledge base, Elastic itself gives this advice:
If you are on EC2, beware of EBS. Even the SSD-backed EBS options are often slower than local instance storage.
In the beginning, we took that advice. We first designed the benchmark to include instances with ephemeral storage. However, there are three considerations to keep in mind when thinking about ephemeral storage on Elasticsearch:
- It wipes upon instance stop. And when running Elasticsearch on AWS, you never know when you will get a system status check failure and have to reboot your instance.
- Whenever your data is deleted, it can take a really long time to recover a cluster — assuming that you have at least one replica — with larger installations.
- Most newer instances do not have ephemeral storage, so your upgrade paths are very limited — you get older hardware and are usually forced to use paravirtualization instead of HVM. (More on that another time.)
Due to these limitations and the fact that instances with enough storage are not cost-effective, we decided to go against Elastic’s recommendation and benchmark EBS as well.
EBS
Surprisingly, EBS (SSD-backed without provisioned IOPS) performed outstandingly well.
We tested only instances that are EBS-optimized and allocate a dedicated NIC to EBS.
Please note: Some instances are EBS-optimized by default, and this is included in the instance price. For others, it’s an optional feature that costs extra, so make sure that you know exactly what you will be charged at the end of the month.
EBS also gives you the ability to change instance types without needing a cluster recovery.
Just shut down Elasticsearch, stop your instance, change the instance type, start it again, and then wait for the quick recovery. (But before you do that, make sure that your cluster is green, you have at least one replica, you have turned off automatic rebalance, and you have preferably run _flush/synced.)
Our Results
Here was the performance of some of the instances that we checked:
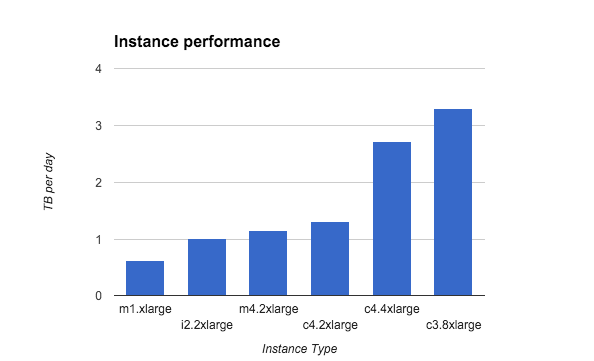
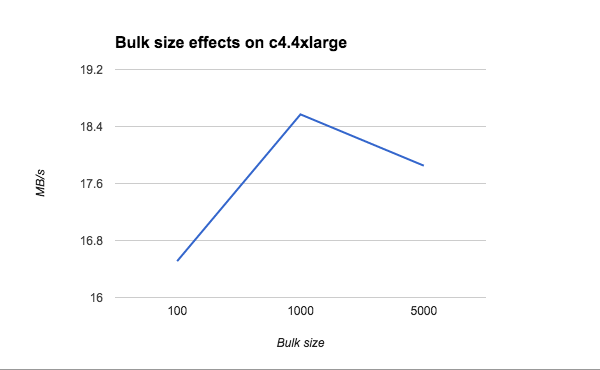
Another important metric to watch and calibrate is your bulk size. The rule of thumb is to start small and increase until you do not see any performance improvement or degradation.
Let’s see the bulk size effect on a c4.4xlarge instance type:
In this graph, you can see the price per hour, the number of instances you need to index 1 TB per day (in terms of storage or performance), and the competitive rate of each (price/indexing capabilities). The lower, the better:
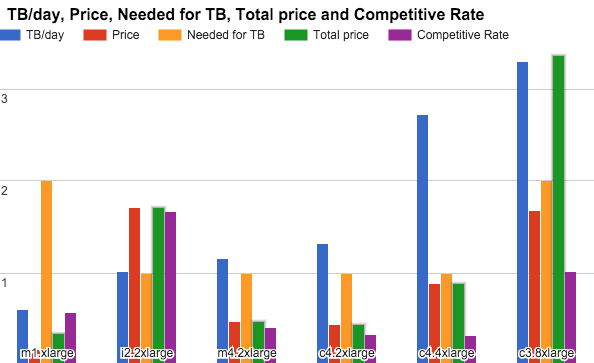
We could not really compare c4.4xlarge to the other two because it is double the price, so we did not benchmark its m4 counterpart and omitted it for now. (Still, it can be a really good choice if you need to index that much data on a single node.)
So, let’s compare the c4.2xlarge and m4.2xlarge. Clearly, the c4.2xlarge could index more and be more cost-effective. But — and it is a big “but” — it had less than half the RAM that the m4.2xlarge had. When it comes to Elasticsearch, you want as much RAM as possible — especially when it’s almost free.
Our Conclusion
After giving it much thought and testing real-life scenarios, we at Logz.io thought that m4.2xlarge is the best instance type for our needs. (Benchmarking is nice, but you always need to test your infrastructure as a real cluster with real data, bursts, and searches.)
More on the subject:
But is that the instance you need? Well, it depends.
Remember: The answer depends on your use case, installation, Elasticsearch parameters, the mood of the cluster that day, and many other factors. But you can use this post as a baseline for your tests.
If you have any interesting results, please share them below! We always love to talk about Elasticsearch, AWS, ELK, or any other geeky stuff.
You Might Also Like

Securing Kubernetes with Open Source Falco and Logz.io Cloud SIEM

6 Things to consider when choosing a log management solution
Get started for free
Completely free for 14 days, no strings attached.