
Amazon EC2 Container System (ECS) Log Analysis – Part 2
In the previous post in this series, I explained how to log ECS container API actions with CloudTrail and ELK. In this second part of the series, I will describe how to log the Docker containers themselves.
There are various ways of logging Docker containers, each with its own advantages and disadvantages. Of course, the challenge in a Dockerized environment, whether on ECS or in a local Docker environment, is the fact that containers are transient, dynamic, and distributed in nature. Not only that, containers produce various types of outputs, so a logging solution that tracks Docker container output will not necessarily track Docker daemon events, for example.
More on the subject:
In the steps below, I will describe two different methods for logging ECS Docker containers — one uses a Docker log collector that pulls container logs, stats, and daemon events into the Logz.io ELK Stack. The second option, uses the aws-logs logging driver to log container logs only to CloudWatch.
Prerequisites
This article assumes that you have an ECS cluster setup in AWS. If you do not have that setup and are just getting started with the service, I highly recommend this getting started with ECS console walk-through — it will take you through the steps for setting up a cluster that will serve a simple web application. I also recommend reading up on the ECS service on the AWS documentation site.
Logging to the Logz.io ELK Stack
To pass container logs to the Logz.io ELK Stack using the log collector, we need to create a new task definition that includes a volume definition and passes the Logz.io token as an environment variable.
In the ECS console, select the Task Definitions tab on the left and then click the Create New Task Definition button.
Name the new task definition (e.g., ‘logzio-docker’), and if you have a specific IAM role you wish to attach to the task, enter it in the Task Role field.
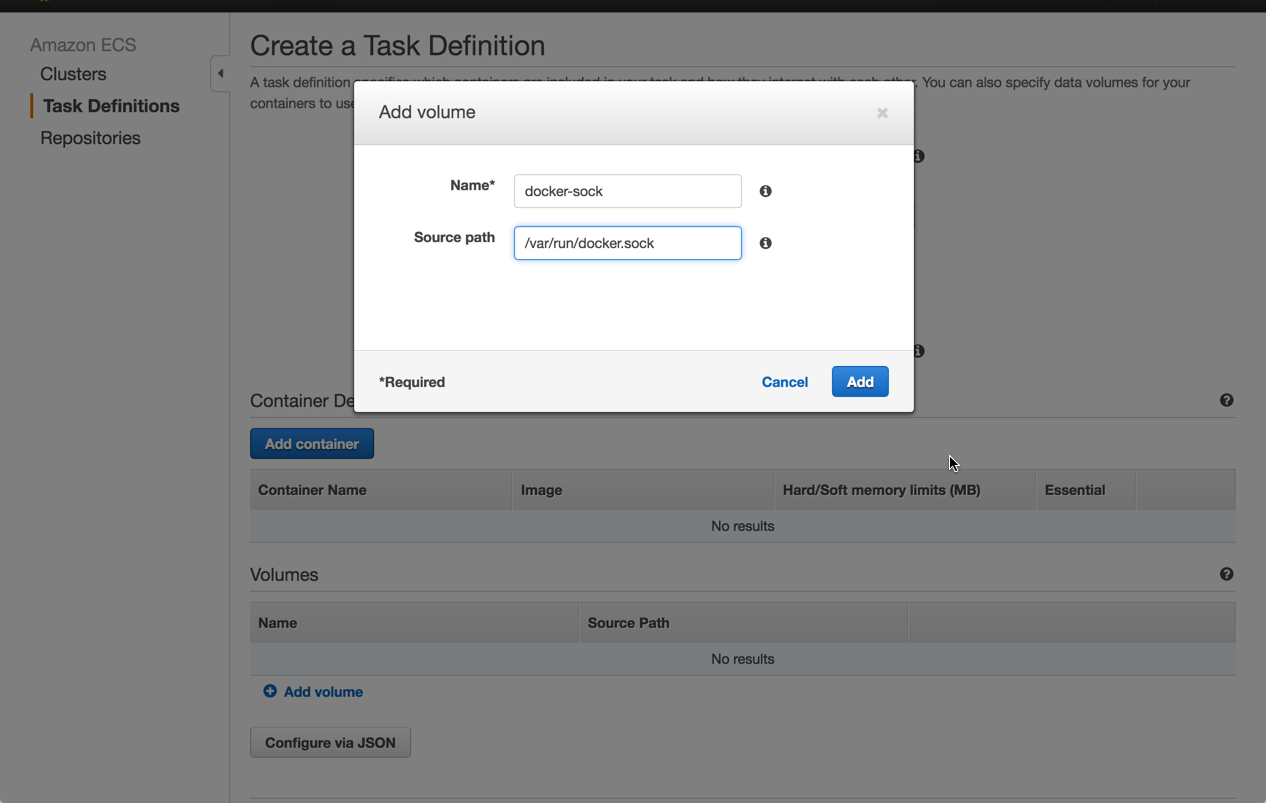
Before we configure a new container, we are going to define a new data volume for our task to make sure that the data will persist even after all of the containers that referenced it has stopped.
Under the Volumes section, click Add volume, and enter the following volume:
Next, enter the following JSON configuration:
{
   "networkMode": "bridge",
   "taskRoleArn": null,
   "containerDefinitions": [
      {
         "volumesFrom": [],
         "memory": null,
         "extraHosts": null,
         "dnsServers": null,
         "disableNetworking": null,
         "dnsSearchDomains": null,
         "portMappings": [],
         "hostname": null,
         "essential": true,
         "entryPoint": null,
         "mountPoints": [
            {
               "containerPath": "/var/run/docker.sock",
               "sourceVolume": "docker-sock",
               "readOnly": true
            }
         ],
         "name": "logzio-docker",
         "ulimits": null,
         "dockerSecurityOptions": null,
         "environment": [
            {
               "name": "LOGZIO_TOKEN",
               "value": "logz-token"
            }
         ],
         "links": null,
         "workingDirectory": null,
         "readonlyRootFilesystem": false,
         "image": "logzio/logzio-docker",
         "command": null,
         "user": null,
         "dockerLabels": null,
         "logConfiguration": null,
         "cpu": 0,
         "privileged": true,
         "memoryReservation": 128
      }
   ],
   "volumes": [
      {
         "host": {
            "sourcePath": "/var/run/docker.sock"
         },
         "name": "docker-sock"
      }
   ],
   "family": "logzio-docker"
}
Make sure that you replace the ‘logz-token’ placeholder with your Logz.io account token before saving the configuration.
Also, please note that some of the container options used in this configurations are optional — change them as you see fit in terms of however it will suit your requirements. If this is your first time, you might want to use the new container wizard (just click Add container on the new task definition page).
The next step is to create (or update) the task and run it in your ECS cluster. If all goes well, you should see a green RUNNING status alongside the task in your cluster view.
All that’s left to do now is to open your Logz.io user interface and begin to analyze the logs:
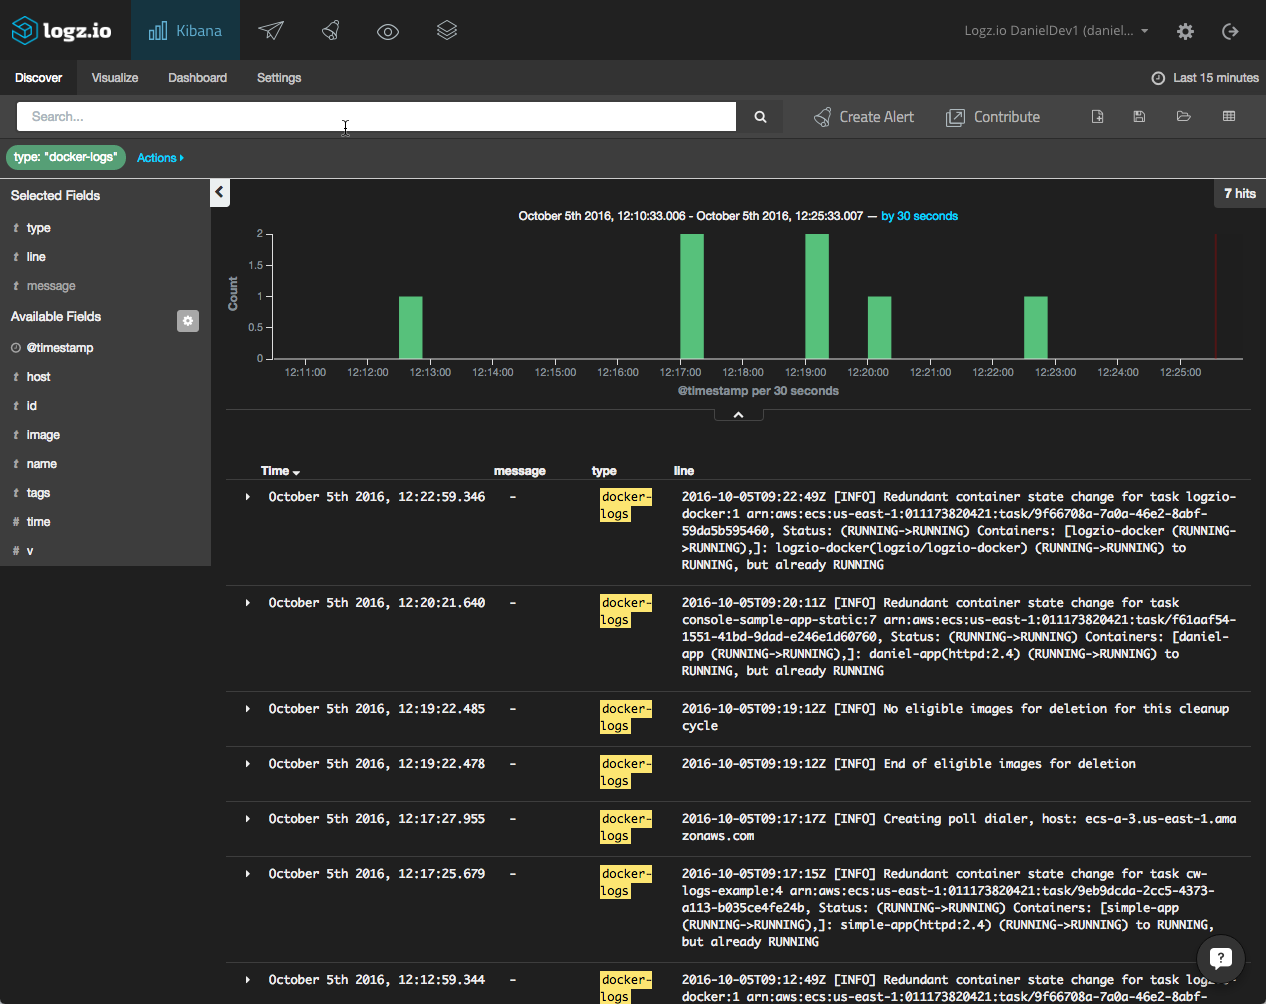
Remember, the log collector collects a mixture of logs — Docker daemon events, Docker logs, and Docker stats. Be sure to differentiate the different output types using the type field, as shown in the image above.
Analyzing and visualizing the logs
Great! You’ve shipped the ECS container logs into ELK. What next?
The next step is to begin to analyze the data, a task for which ELK is renowned due to its rich querying options and visualization features. Use Kibana to search container logs for events taking place in your environment, and use the visualizations to create your own monitoring dashboard.
To help you hit the ground running, you can use one of the ELK Apps — a library of free customized Kibana searches, alerts, visualizations, and dashboards — to install a pre-built dashboard for logs collected by the log collector.
Here’s what it looks like:
 Log Analysis - Part 2")
Logging to AWS CloudWatch
Another way you can log ECS containers is by using CloudWatch and Docker’s built-in log drivers. As described in this post, there are a number of drivers for logging Docker containers, each of which allows one to export the stderr and stdout output for containers to a specific logging tool.
Using the aws-logs driver, you can send these container logs to CloudWatch for storage and analysis in third-party monitoring and logging tools. Note, this option does not allow you to aggregate Docker stats and Docker daemon events in the same pipeline.
To log to CloudWatch, you will need to update the logging section of your ECS task definition (set to “null,” usually).
When you edit the task’s JSON configuration, the logging section will look as follows:
"logConfiguration": {
         "logDriver": "awslogs",
         "options": {
            "awslogs-group": "log-group",
            "awslogs-region": "aws-region",
            "awslogs-stream-prefix": "log-stream-prefix"
         }
      },
Make sure to replace the placeholders above with your CloudWatch configurations:
- log-group – the name of your CloudWatch log group
- aws-region – the AWS region for CloudWatch
- log-stream-prefix – the prefix and name of your CloudWatch log stream
Create and run the task in your ECS cluster. Open the log stream in CloudWatch, and you should start to see your container logs:
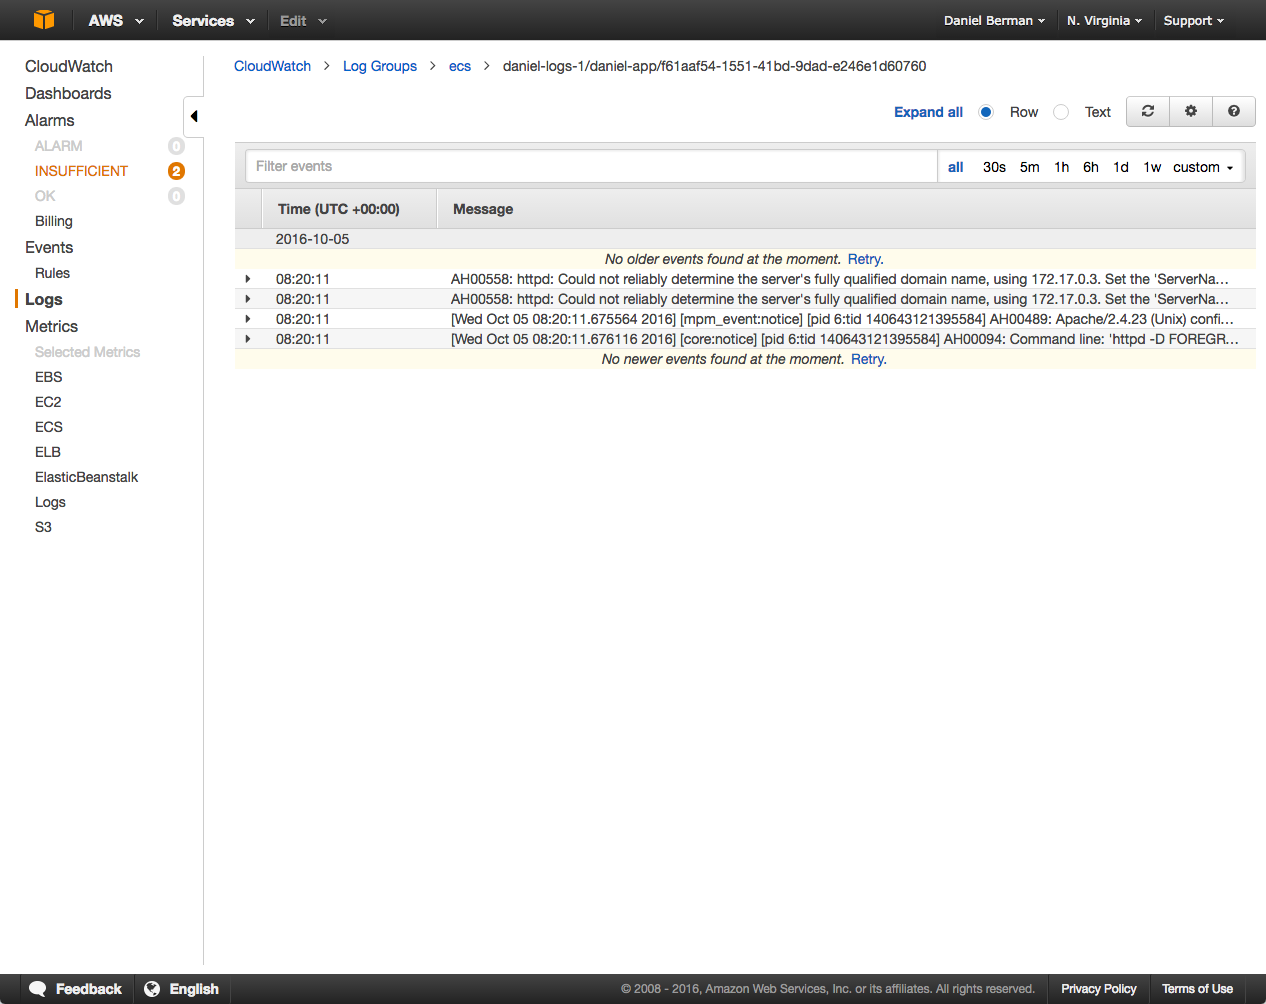
Once in CloudWatch, you can tap into any other monitoring and logging system to analyze the logs. You could, for example, ship the logs to an S3 bucket for storage and extraction into the ELK Stack.
For related information, I recommend reading our blog post on shipping S3 logs into the Logz.io ELK Stack as well.
You Might Also Like

How to Defend Your Business Against SQL Injections
API Analysis with the ELK Stack
Get started for free
Completely free for 14 days, no strings attached.